Spotify Wrapped 2022: My listening personality and more
It’s time for another deep dive into this year’s Spotify Wrapped! I’ve been doing this for almost as long as Spotify Wrapped has existed. Check out the past years’ posts: 2018, 2019, 2020, 2021.
I collect my music data using Last.fm, and then I wrote a custom Last.fm add-on for Splunk to send my listening data to Splunk. I then use the app I developed, Music App for Splunk to visualize the results. Both the add-on and the app are open source, so feel free to try it out yourself if you use Last.fm.
Spotify vs Last.fm #
In the four years that I’ve been writing these posts I’ve reveled in the data missing from Spotify Wrapped and crow a bit about the superiority of quantifying my music habits more holistically with Last.fm. Spotify Wrapped, as you might know, is based on your listening patterns in Spotify from January 1st through October 31.
This year, I made more of an effort to diversify my music listening habits and also spent less time on my computer, both of which I hope meant I spent less time listening to music on Spotify. Did it work?
To find out, I compared my Spotify and Last.fm top artists, songs, etc. using the same time range: January 1, 2022 – October 31, 2022.
Top artists #
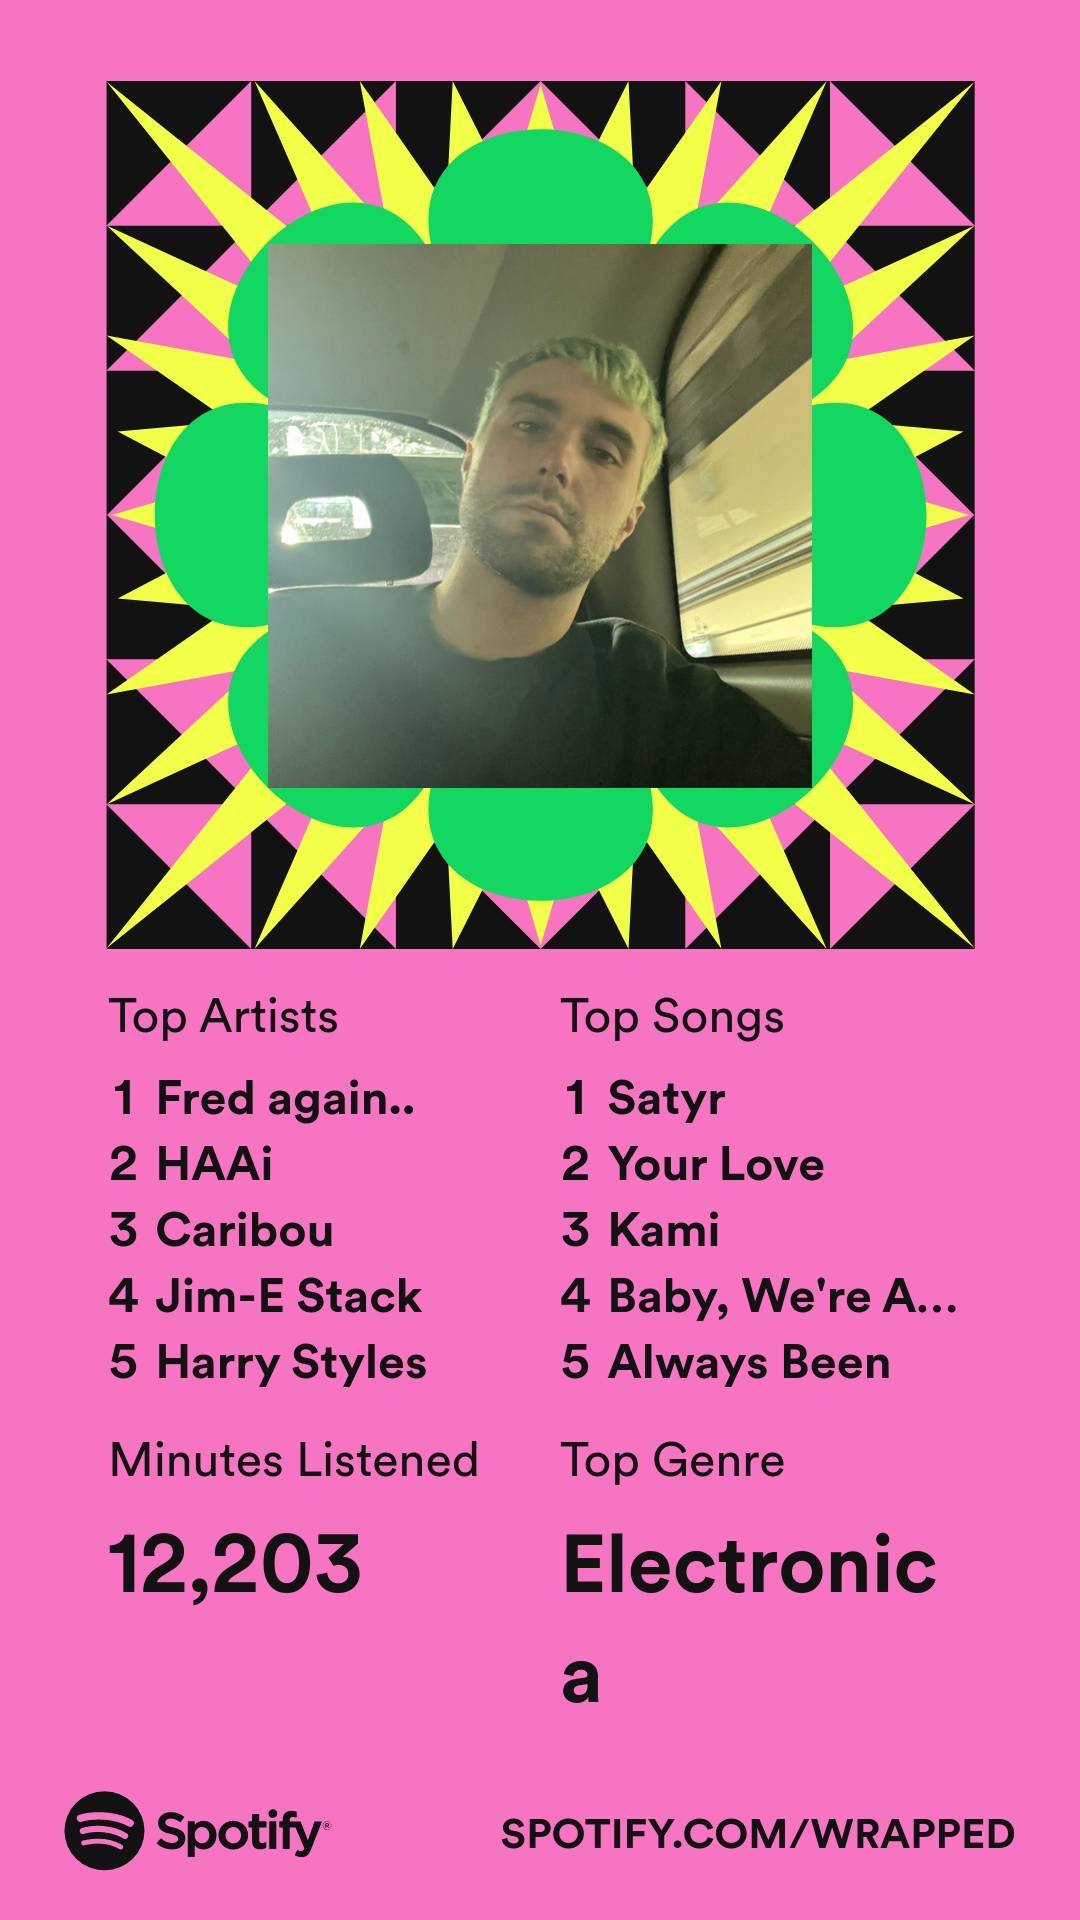
According to Spotify, my top 5 artists of 2022 were the following:
For the same time range, my top 5 artists according to Last.fm were the following:
These are pretty similar lists! I’m somewhat surprised to see Jacques Greene in the top 5 for this time period, as well as Harry Styles. I listened to Harry Styles for a day or two on Spotify because a friend of mine loved his album Harry’s House, so I wanted to give it a fair shake. That must have been enough concentrated listening to put him into the top 5.
Top songs #
According to Spotify, my top 5 songs of 2022 were the following:
- O’Flynn and Frazer Ray - Satyr
- Tourist - Your Love
- Monkey Safari - Kami
- HAAi and Jon Hopkins - Baby, We’re Ascending
- I. Jordan - Always Been
For the same time range, my top 5 songs according to Last.fm were the following:
- Beyoncé - Break My Soul
- Hadiya George - Hot Flavor (Godmode Smash Brothers Remix)
- salute - Honey
- TSHA - Water (feat. Oumou Sangaré)
- Griff - Say it Again (TSHA Remix)
None of the same songs or even artists on both lists this time. I think this is pretty indicative of a strong discovery-to-purchase pipeline with my listening habits this year. After I realized I was listening to a song a lot on Spotify, I’d buy it (and then stop using Spotify to listen to it).
Most of the top songs from Last.fm are songs that I purchased and then listened to frequently on my phone.
Total artist and song listens #
Spotify Wrapped also includes data about the total number of artists and songs listened to on their platform. Comparing that data with Last.fm leads to a couple interesting insights.
| data source | total artists |
|---|---|
| Last.fm | 2006 |
| Spotify | 1815 |
These numbers are very close together, despite the fact that I spent much less time listening on Spotify this year. It’s likely that the way that Spotify stores artist metadata for songs differently than Last.fm is coming into play again here. As I’ve noted in the past, Spotify stores a list of artists for each track as an array/multi-value field, but Last.fm assigns just one artist for a track.
It’s possible that Spotify might attempt to clean up this number to be more precise, but given that cleaning the number of artists listened to would reduce the total, I find it unlikely that the data scientists building Wrapped would make that decision. The purpose of Spotify Wrapped, after all, is marketing rather than precision.
If the data is cleaned up, the more similar totals could be explained by me doing the vast majority of my music discovery on Spotify, and use SoundCloud, YouTube, and Apple Music (iTunes) to listen to artists that I discovered already on Spotify.
That would mean that I have a large breadth of artists that I listen to on Spotify, and roughly the same number according to Last.fm (which includes Spotify listening data), again possibly reinforcing a discovery-to-purchase pipeline enabled by Spotify.
Looking at the total songs seems to lend further credence to this theory:
| data source | total songs |
|---|---|
| Last.fm | 4023 |
| Spotify | 2267 |
The total number of songs that I listened to in this time period are nearly twice as many on Last.fm compared to Spotify. This is a stark difference. It’s almost certain that my Last.fm data has some anomalies from watching YouTube videos like those from Mentour Pilot, despite my best attempts to clean that up in the data1.
Beyond data errors, however, it’s also clear that my attempts to diversify where I listen to music are apparent in the data.
Diversifying my listens #
As a grand total, Spotify calculated that I spent 12,203 minutes listening to music in Spotify between the beginning of January and the end of October. Compared with last year, that’s a dramatic drop. I listened to music using Spotify for 62,214 minutes in 2021.
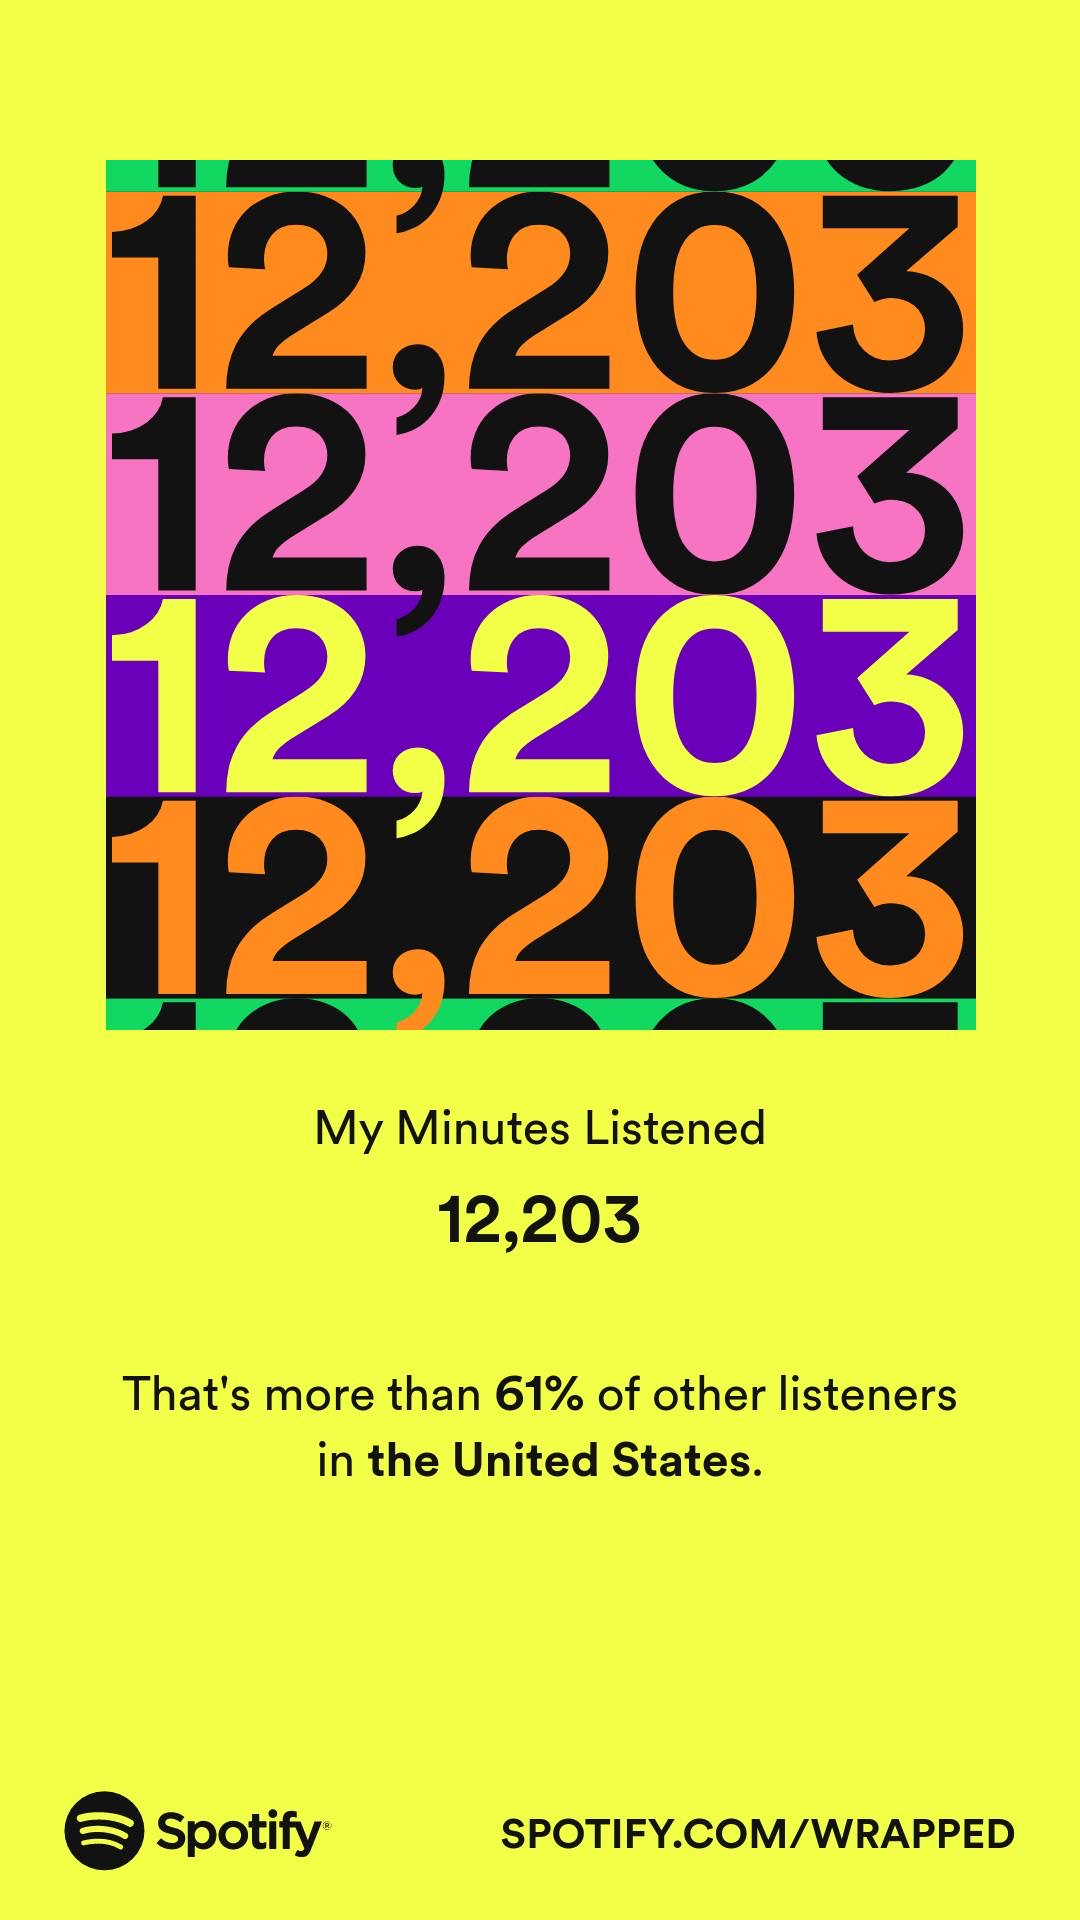
If I compare the Spotify data with the rest of my data for the same time period, I get a result of 25,614 minutes listened2. This means that when I was listening to music between January and October, I spent less than half of that time listening on Spotify.
What was I doing instead? Listening to purchased music in Apple Music on my laptop or my phone, listening to my SoundCloud Weekly playlists on SoundCloud, or digging into Tiny Desk Concerts, an epic live performance featuring an organ, and other music on YouTube.
I primarily listened to newer music on Spotify, using it for the Release Radar playlist and any other new albums that I wanted to check out.
Out of the total minutes for this time period, Spotify claims I spent 159 listening to Fred again… Given that I listened to Fred again.. tracks 181 times according to Last.fm, the real number was closer to 319 minutes3. I apparently couldn’t stop listening to his track Jungle, which is accurate because that was my top song for that time range.
My top song #
According to Spotify, I listened to Satyr by O’Flynn and Frazer Ray the most on July 17, 2022. The track came out July 14, 2022, but I’m not sure why Spotify called that song and date out specifically.
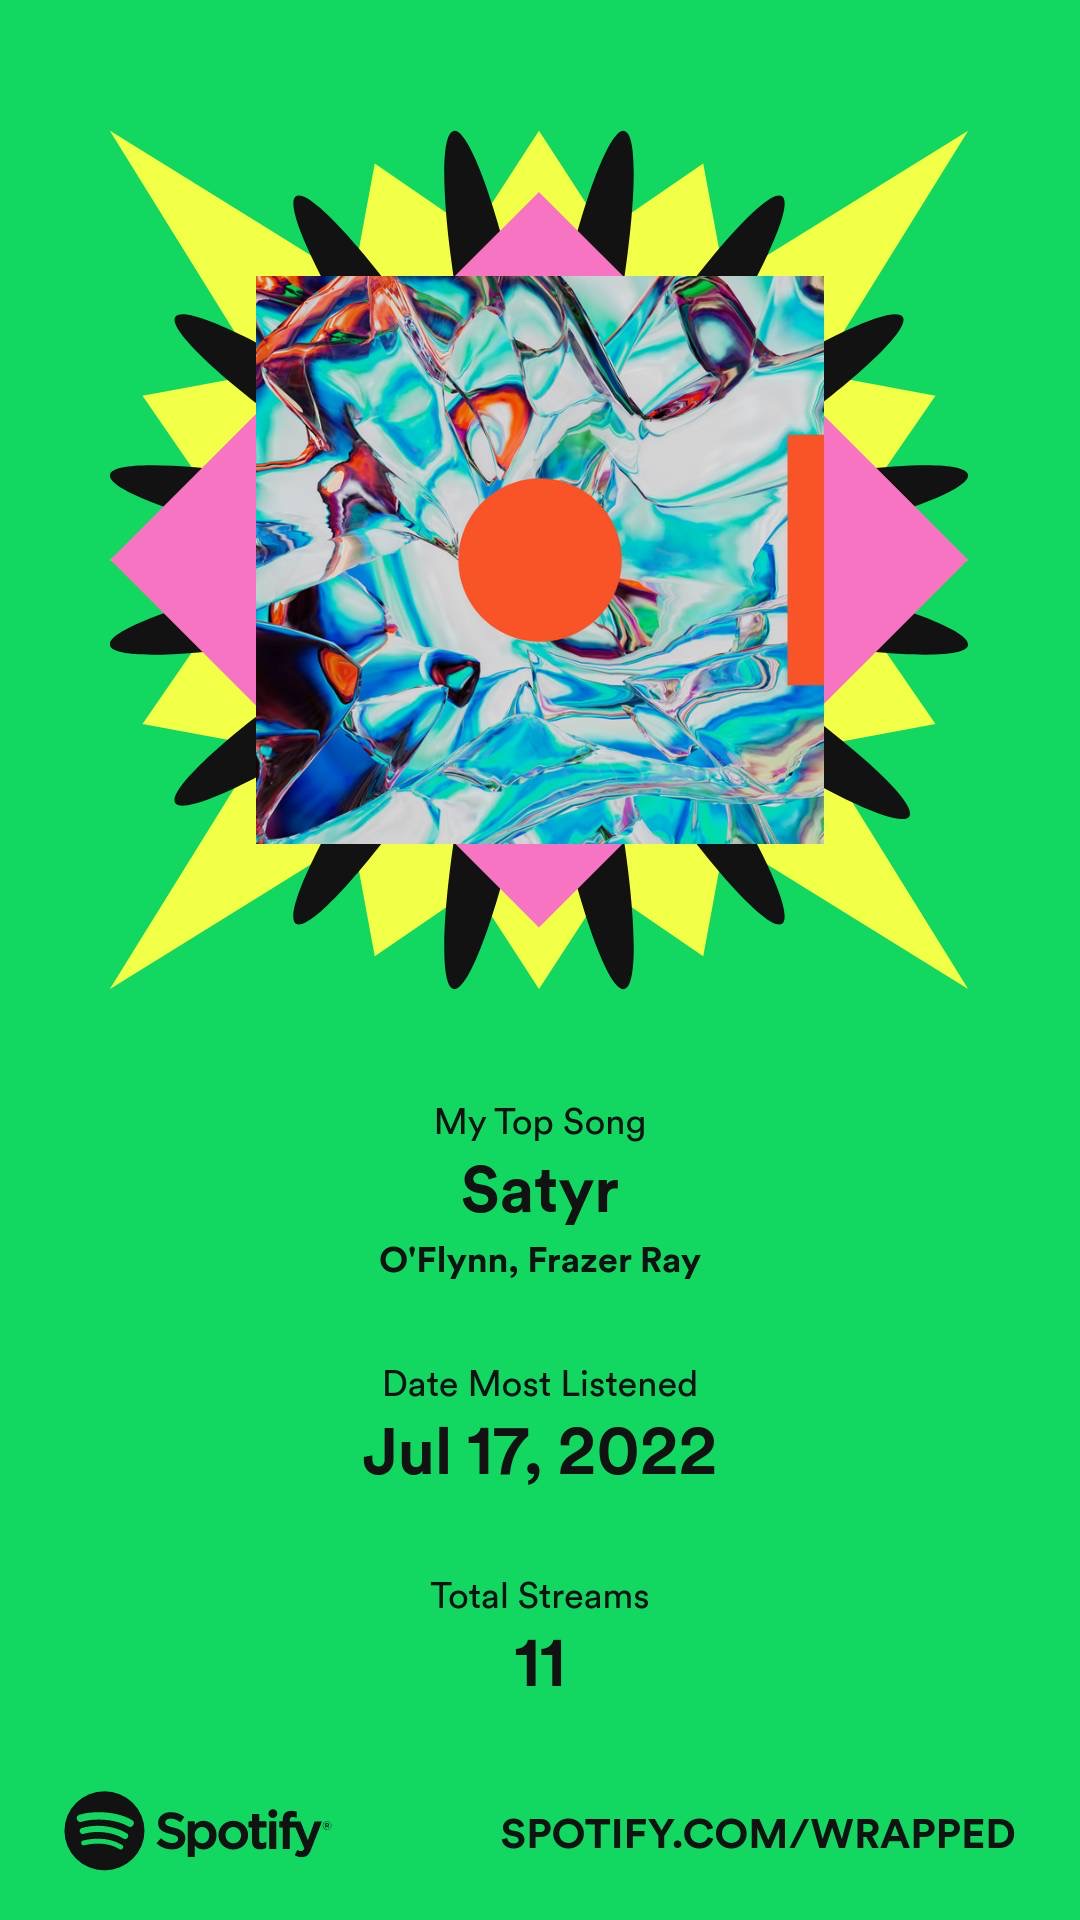
According to my data, two days are tied for the most listens of that track:
- July 17. 2022
- August 16, 2022
Both days have a total of just two listens each. I think a pattern throughout my listening activity this year is that I didn’t have a lot of songs that were on constant repeat for me—and those that were, I didn’t listen to on Spotify.
Spotify called out that this song had 11 listens, and I had 13 listens recorded in my Last.fm data for the same time period as Spotify Wrapped.
Here’s the backstory of the data, at best guess:
When I realized that Satyr was a single off a forthcoming album by O’Flynn and Frazer Ray, I pre-ordered it. The album came out October 21, 2022, but Satyr was released as an album single on September 26, 2022. It’s likely that any listens of that track after that date happened in Apple Music—either on my phone or my computer.
Because I spent much less time listening on Spotify this year, the song that was truly an obsession on one day wasn’t captured in Spotify Wrapped at all. I listened to Hadiya George’s track Hot Flavor (Godmode Smash Brothers Remix) 14 times on Tuesday, August 23—more times than I listened to Satyr for the entire time period covered by Spotify Wrapped.
What Spotify Wrapped does offer, which I can’t evaluate as easily with my own listening data, is aggregated data insights.
A peek inside the Spotify data factory #
As Spotify Wrapped continues to evolve, Spotify reveals more and more of their data science practices in as part of the stories about your “year” in music.
As Amanda Hoover reports in The Big Problem With Spotify Wrapped, Spotify leverages the extensive amount of data they collect—especially listening behavior of users and derived metadata about the music, like mood—to create Spotify Wrapped.
What makes Spotify so good at creating these lists and predicting the music that users want to hear is a robust artificial intelligence system and its immense data trove.
Beyond sharing personalized listening insights, Spotify has exposed their data storage methods and hinted at the mood descriptor metadata they derive from music in past versions of Spotify Wrapped.
Their data storage methods became more apparent to the average Spotify user with Spotify Wrapped 2020. In my 2020 post, I pointed out that the way that Spotify stores artist metadata affects the data they share:
Because Spotify stores all artists that contributed to a track as an array, I can listen to a track with 4 contributing artists on it, 1 of which I’ve listened to before, and according to Spotify, I’ve now discovered 3 artists and listened to 4
This was especially apparent in the genre discovery slide, where Spotify revealed the number of niche and hyper-specific genres that it assigned to artists:
According to Spotify, I listened to 801 genres this year, including 294 new ones. I’m not even sure I could name 30 genres, let alone 300 or 800. Where are these numbers coming from?
It turns out that, much like storing artist data as an array for each song, Spotify stores genre data as an array for each artist. This means that each artist can be assigned multiple genres, thus successfully inflating the number of genres that you’ve listened to in 2020.
For Spotify Wrapped 2021, Spotify took it a step further and crafted “musical auras” for users eligible for Spotify Wrapped. I explored this in my 2021 post:
My best guess is that there must be an internal API that contains mood descriptors for Spotify tracks that helps them build their emotion-based playlists. The closest metadata available in public APIs is the “energy” audio feature, which isn’t enough on its own to associate with an emotion (at least in my opinion).
This year, Spotify exposed their trove of insights with two new features:
My Spotify listening personality #
I love personality tests. They give you a certain amount of insight into your behavior and personality based on questions that you answer about your activity, behavior, or feelings.
Most frameworks for deriving personality insights use questions about your behavior to draw conclusions, like attachment styles, love languages, four tendencies, Myers-Briggs type indicator, or the enneagram. That’s because the simplest way to draw conclusions from your behavior is to ask about it.
Spotify didn’t have to ask any questions to derive my listening personality—it has enough behavioral data that it collects when I use the service to listen to music.
Spotify collects user-specific behavioral data such as:
- what music I listen to
- which songs I add to playlists
- the names of the playlists that I listen to
- the time of day that I listen to music
- whether I skip a track or keep listening to the end
as well as less personal data, such as:
- what people are saying online about various artists
- the characteristics of specific tracks, such as their energy or valence
- which artists and tracks tend to get added to which playlists
- the lyrics of various tracks
With all of that data about me and the music I listen to, Spotify derived a listening personality for me: The Specialist.
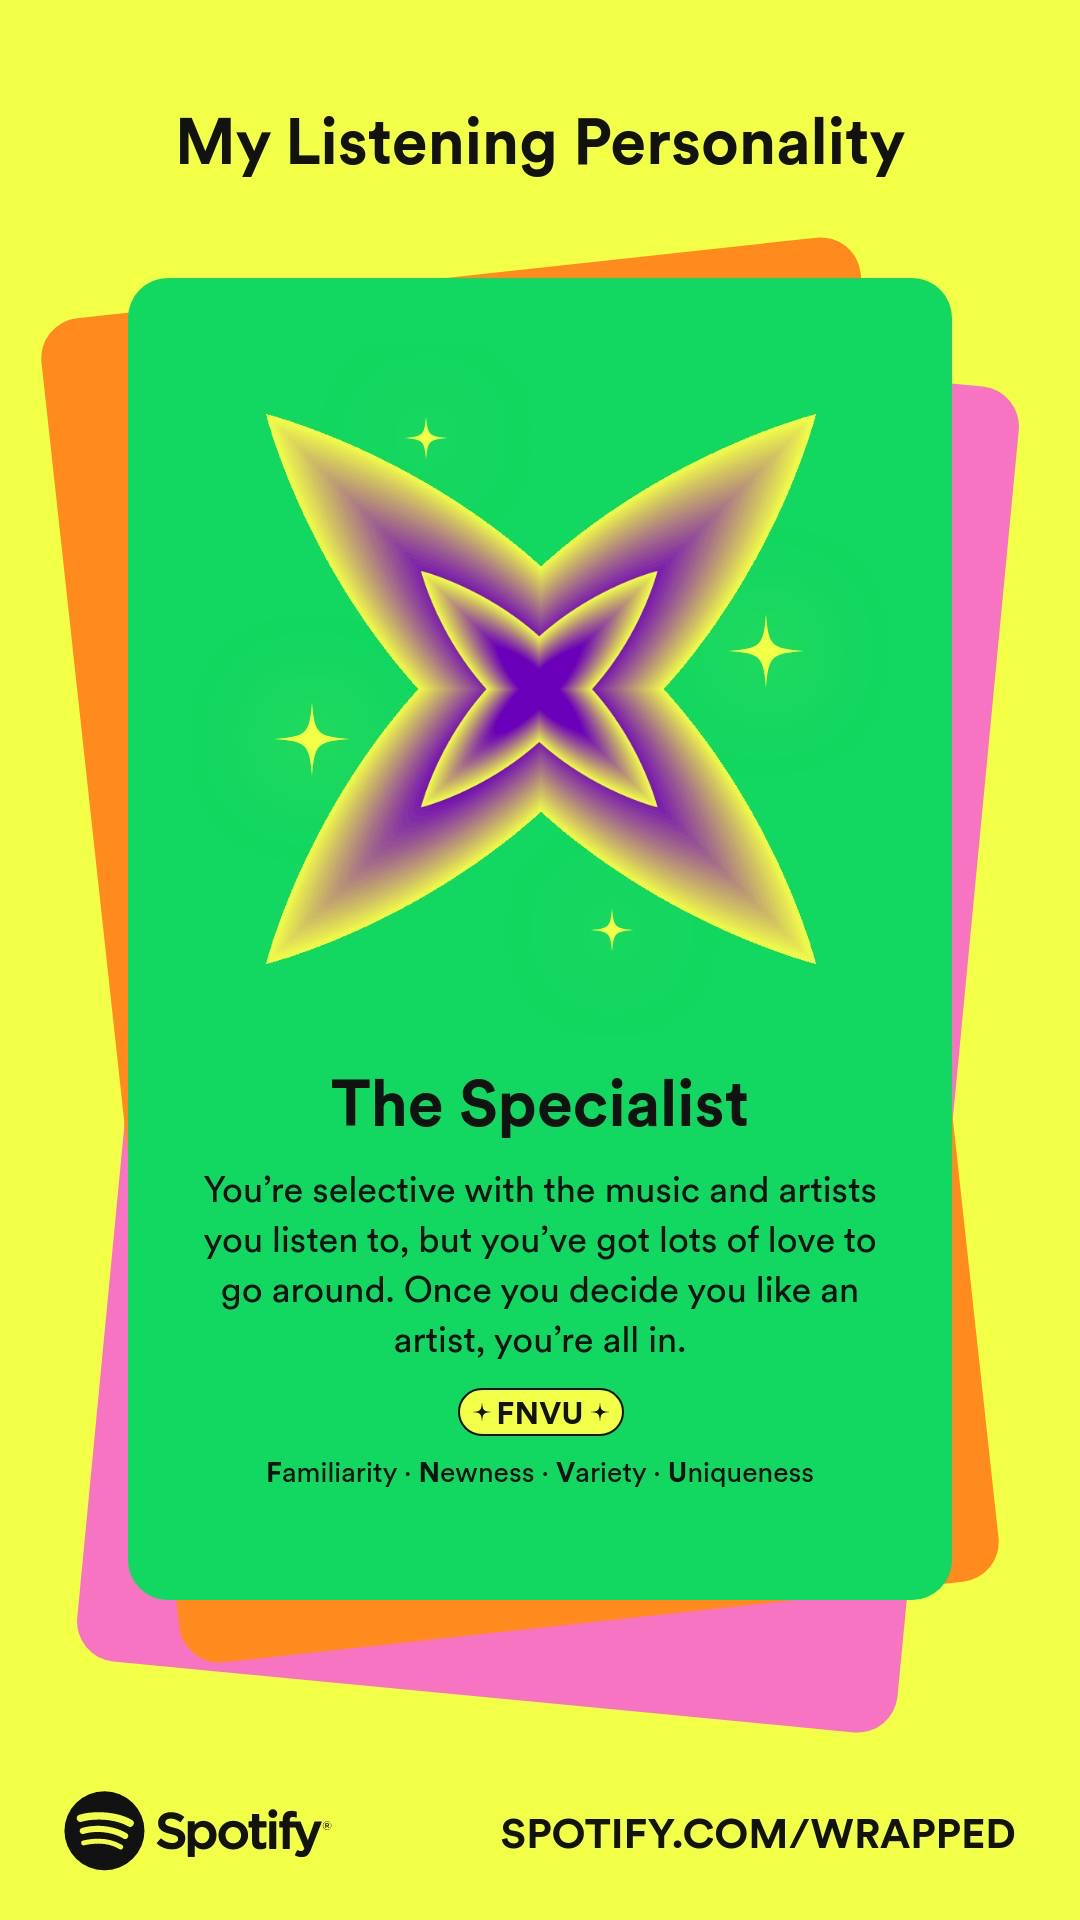
Similar to a Myers-Briggs personality test, Spotify gave me a personality of FNVU:
- Familiarity
- Newness
- Variety
- Uniqueness
You’re selective with the music and artists you listen to, but you’ve got lots of love to go around. Once you decide you like an artist, you’re all in.
Based on a blog post that Spotify published, Get to Know Your Music Listening Personality from 2022 Wrapped, there were 16 possible combinations made up of these 8 options (paraphrased by me from the post):
| one option | complementary option |
|---|---|
| Familiarity You mostly listen to your favorite artists over and over. |
Exploration You sample a lot of new artists. |
| Timelessness You wander the vast catalog of all the music ever made. |
Newness You listen to brand new music right when it comes out. |
| Loyalty You find yourself going back to the same tracks and playing them on repeat. |
Variety You like to spin through a lot of music before repeating. |
| Commonality You listen to mostly popular artists along with millions of fellow fans. |
Uniqueness You look deeper for someone less well known. |
Spotify, in their blog post, refers to these as four metrics. And that’s because they’re based on four metrics (although revealed to us as 8 options). The blog post doesn’t provide any additional details about these metrics, so from here on out I’m speculating.
Based on another blog post from Spotify, Everything You Need To Know About 2022 Wrapped, I’m fairly certain that this profile was calculated specifically for Spotify Wrapped over the January – October time period:
Your Wrapped will showcase your Listening Personality based on how you listened to music throughout the year.
In my opinion, these are the four metrics used to derive the Spotify listening personality:
It’s a fairly straightforward algorithmic profile of your listening behavior, and one adjacent to the one that Spotify likely already creates in order to craft recommendations and tracks for Discover Weekly, Release Radar, and other algorithmic playlists like Daily Mixes.
What do these metrics look like, and how might they be calculated?
Familiarity / Exploration #
Familiarity and exploration are derived from your artist discovery listening patterns.
This metric is likely calculated as follows: given the listens during a set time period, how many were of artists discovered this year and how many were of artists discovered in previous years?
I’m able to calculate this metric with my own data 4.
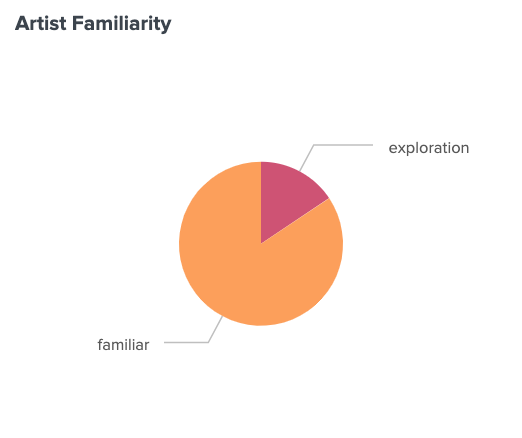
Based on my data, this is an accurate metric for me. 84.4% of my listens were of artists discovered before 2022, while 15.6% of my listens were of artists that I discovered in 2022. Tendency toward familiar artists, confirmed.
Timelessness / Newness #
Timelessness and newness are derived from the newness of the tracks that you’re listening to, based on release date.
This metric is likely calculated as follows: given the listens during a set time period, how many listens were of songs that were released in the last 18 months, and how many were of songs released before that 18 month period.
I’m assuming that with this metric, Spotify is defining newness the same way the rest of the music industry does: new tracks are those released in the last 18 months. Anything older than that is considered part of an artist’s “catalog” 5.
It’s even more likely that Spotify is comparing catalog and non-catalog listening behavior with this metric because that’s exactly what they did in their latest Fan Study research report, released in September 2022 based on data from April 2022.
This metric is also easy for Spotify to calculate, because they have track metadata directly from the music distributors and record labels.
I can’t calculate this metric nearly as accurately as Spotify, because I only have release date data for 12.9% of the tracks that I listened to this year 6. Because I get release date data from my iTunes library, I’m limited to the data that exists for tracks that I own, and only tracks that I purchased through the iTunes store contain release date metadata (I assume).
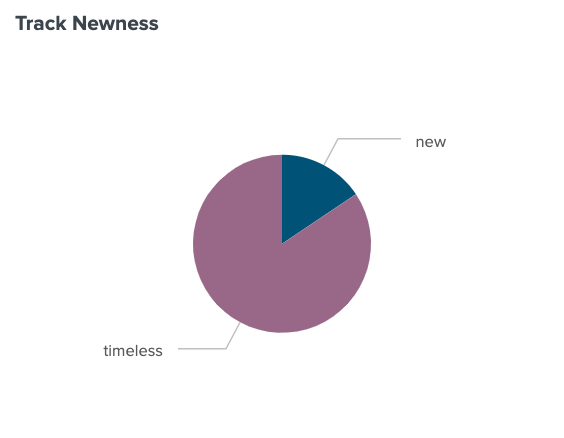
Of the 12.9% of tracks for which I have data, 18.4% of my listens in the set time period were of tracks released between April 30, 2021 and October 31, 2022. 81.6% of my listens were of tracks released before that date.
To reinforce the low data that this is based on, only 160 listens are reflected in the 18.4%, and 711 listens are reflected in the 81.6%, out of total listens of 6522 songs. It’s a tiny amount of data, but it’s different from what Spotify classified for me. I think this is largely because I use Spotify primarily to listen to new music, such as with Release Radar, before I buy it.
Loyalty / Variety #
Loyalty and variety are derived from your track listening patterns.
This metric is likely calculated as follows: given the listens during a set time period, how often did you listen to the same track, compared with listening to other tracks.
I can calculate this with my own data by using a time window and looking for repeat track listens during a given time window 7.
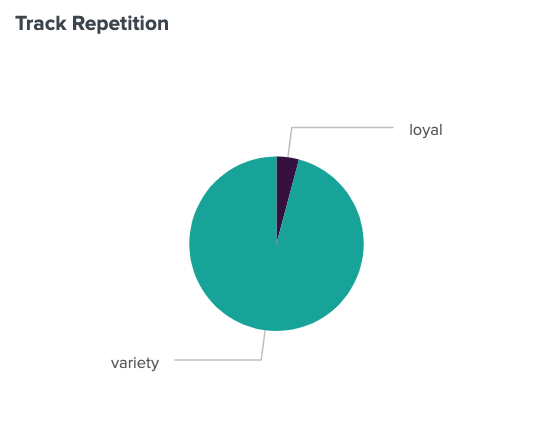
95.8% of my listens are to different tracks within a given 20-minute-long time window during the set period of January 1st – October 31st. A scant 4.2% of those time windows were loyal to specific tracks. Some notable moments 8:
- July 13, 2022 11:00AM–11:20AM, I listened to salute’s track Honey 4 times
- August 23, 2022 9:20PM–9:40PM, I listened to Hadiya George’s track Hot Flavor (Godmode Smash Brothers Remix) 4 times
The tracks that I listened to on repeat most frequently (across multiple time windows) were:
- Hadiya George - Hot Flavor (Godmode Smash Brothers Remix)
- Rochelle Jordan - ALREADY
- KC Lights - Cold Light (Extended Mix)
- Griff - Say it Again (TSHA Remix)
- Jacques Greene - (Baby I Don’t Know) What You Want
I based my assumption about this metric on time windows largely due to the Spotify Research blog post, The Dynamics of Exploration on Spotify, specifically the section about The Online Lifecycle: Exploratory Phases.
In that post, Spotify researchers disclose the methods they used to identify patterns in user exploration and discovery
we looked at how much listeners explored between time windows (again, we used a week) in their individual traces and measured the discovery rate interquartile range (IQR) over windows with multiple streams.
users actually chain exploration-heavy windows together. If you already started exploring, you are more likely to keep going; if you have not started exploring yet, you are also more likely to not start in the next week. So, there seem to be phases of both content exploration and content revisitation.
It’s possible that Spotify used similar methodologies to determine loyalty or variety tendencies for the Spotify Wrapped personality metrics, but without more details, I can only speculate. For now, I can confirm with my own data that Spotify accurately categorized me as seeking out variety in my listening patterns.
Commonality / Uniqueness #
Commonality and uniqueness are derived from the popularity of the tracks you listen to.
This metric is likely calculated as follows: given the listens during a set time period, how many had a high popularity value?
Spotify maintains a popularity metric for each track in their library, but I’m not sure what popularity score might be considered common compared to unique for this metric.
I don’t have a popularity metric for each song in my library, because I don’t have access to listening behavior for millions of tracks by millions of users. What I can do, is use the Spotify Web Console to call Get Playlist Items for my Top Songs 2022 playlist and gather popularity metrics for the tracks on that playlist.
| artist | track_name | popularity |
|---|---|---|
| Harry Styles | Late Night Talking | 90 |
| Harry Styles | Music For a Sushi Restaurant | 83 |
| Beyoncé | BREAK MY SOUL | 79 |
| Harry Styles | Grapejuice | 78 |
| Burna Boy | Last Last | 75 |
| Pheelz | Finesse | 74 |
| Burna Boy | It’s Plenty | 74 |
| Fred again.. | Jungle | 72 |
| Maverick Sabre | Slow Down (feat. Jorja Smith) - Vintage Culture & Slow Motion Remix | 71 |
Based on the artists at the top end of the popularity score, let’s say that a popularity score of 75 and above makes a song common and anything lower makes it unique.
For the 100 songs that I have data for, 4.1% of my listens were to common songs, and 95.9% of my listens were to unique songs.
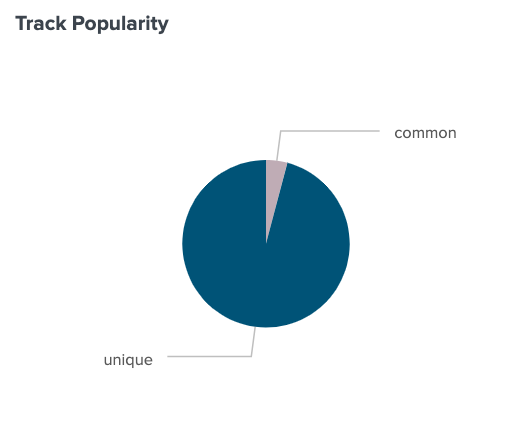
It’s also worth noting that I only listened to the songs on my top 100 songs playlist a total of 241 times during this time period. To get a more accurate score based on my Last.fm data I’d need a lot more data, but I think this is a pretty accurate depiction of my listening behavior overall. Tendency toward unique artists, confirmed.
Spotify Wrapped included more than just a listening personality—this year it also assigned mood descriptors to different times of day.
My Spotify Audio Day #
According to the Everything You Need To Know About 2022 Wrapped blog post from Spotify:
Audio Day showcases the niche moods and aesthetic descriptors of the music you listened to during morning, midday, and evening time periods.
For me, that looked like the following
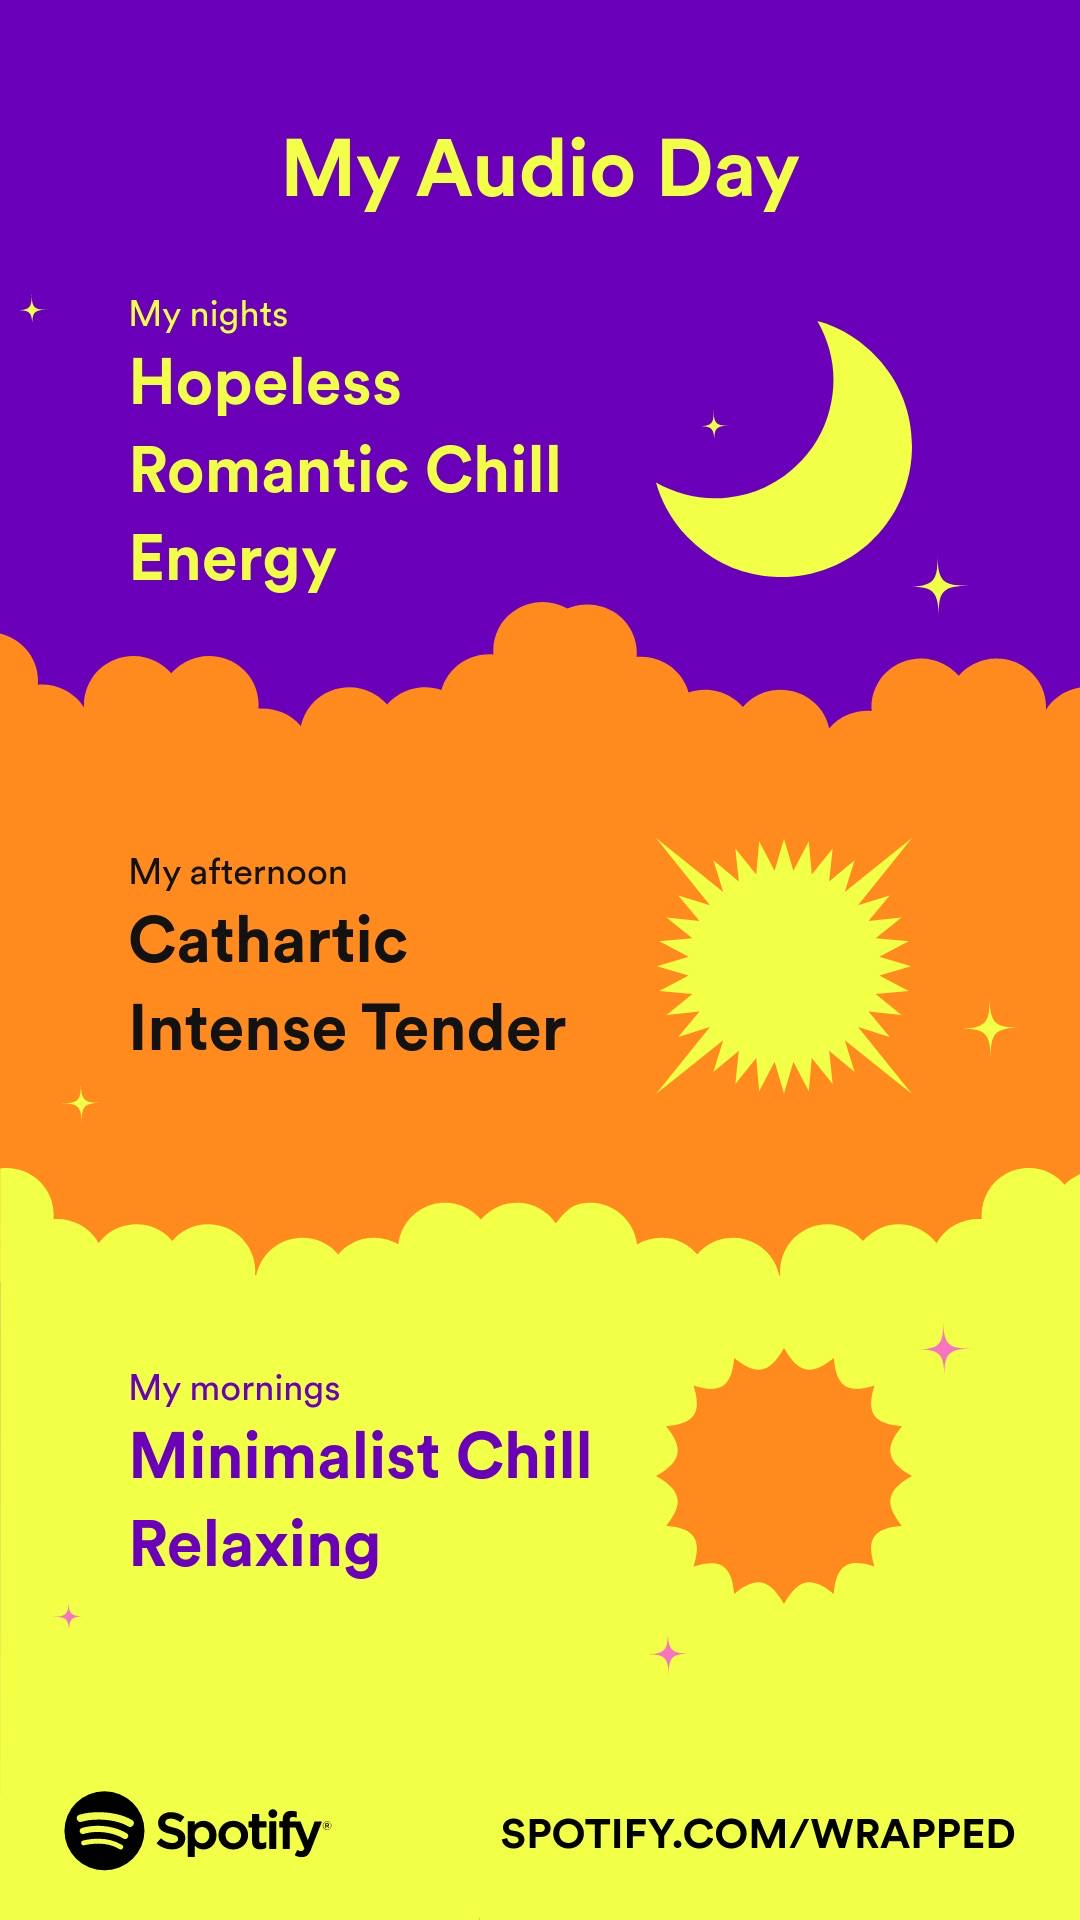
While my Audio Day descriptors were somewhat bland:
- Minimalist
- Chill Relaxing
- Cathartic
- Intense Tender
- Hopeless Romantic
- Chill Energy
Some of my friends had more mystifying and novel descriptors:
- Acceptance Sad
- Sad Boi
- Zen Peaceful
- Yearning
- Energizing
- Relaxing Calm
It’s unclear if each descriptor is a complete phrase, or if it’s actually separate descriptors, based on the seemingly random nature of the categorization.
How did Spotify define these “niche moods and aesthetic descriptors”?
Poking around on the Spotify Research blog, I discovered the post The Contribution of Lyrics and Acoustics to Collaborative Understanding of Mood, which points out:
The association between a song and a mood descriptor was calculated using collaborative data, by “wisdom of the crowd”. More specifically, these relationships were derived from Spotify playlists’ titles and descriptions, by measuring the co-occurrence of a given song in a playlist, and the target mood descriptor in its title or description.
Researchers derived mood descriptions based on the titles and descriptions for playlists that songs were added to by Spotify users. Those mood descriptors were used as the baseline for the rest of the research, which explored whether the energy of a song and the lyrical content could be reliably correlated with mood.
And indeed, the findings of the research asserted that:
by combining information extracted from the two modalities – lyrics and acoustics – we can best predict the relationship between a song and a given mood.
I think that, based on the haphazard nature of the descriptions for My Audio Day, these were likely derived from the playlist title and description data source. Spotify is performing this research, however, to improve recommendations and search. Namely:
we want to enable search based on mood descriptors in the Spotify app, for example by allowing users to search for “happy songs”. Additionally, from the recommendations side, we want to be able to recommend new songs to users that provide similar sets of moods users might already like.
If you want to find tracks representative of your Audio Day, you might want to search for the descriptors on Spotify and look for relevant playlist titles.
For my own descriptors, I found playlists like the following:
Attempting to search for “Cathartic” or “Intense Tender” or “Cathartic Intense Tender” yielded a number of user-created playlists that were exclusively Taylor Swift songs.
All of these playlists contain songs and artists that I listen to frequently, and have saved in my Spotify library. It’s also amusing to me that if you remove the genre identifier and the word “Mix” from the title, they’re near-perfect matches for many of my audio day descriptors.
Maybe my friend with Sad Boi as one of their audio day descriptors spends a lot of time listening to artists on the Sad Boi Hours playlist.
Spotify Wrapped 2022: Deriving metrics for novelty and capitalism #
Why bother digging into all these data points? Spotify Wrapped is full of derived metrics that feel insightful to us, revealing our music listening patterns. For Spotify, those same insights are the backbone of the business.
Collecting data about our behavior and correlating that with computed and explicit metadata on the music and podcasts distributed through the service is how Spotify improves the listening experience on the platform. The better the experience (or the quality of the offerings), the easier it is to entice new users to sign up, subscribe to Premium, and create a captive audience for ad targeting.
This was the first Wrapped where the scope of Spotify’s correlational capabilities was made transparent to the average user. I can’t tell if people are amused, intrigued, or uninterested in these new data points.
It seems to me like the primary focus of the people sharing Spotify Wrapped is to get some new music recommendations, and be recognized for how much time you spent listening to your (possibly) favorite artists and tracks of the year.
For me, it’s always amusing to explore my data through new lenses, and occasionally frustrating to be faced with the holes or errors in my own data collection. But I’m not Spotify. I’m at the mercy of the APIs and data sources that I use to collect my music data, and the documentation that might or might not exist for those sources.
I’ll be back at the end of the month and the year with a full rundown into my top music of 2022, including details about the money earned by artists based on my music habits, what instigated various artist obsessions, and how my listening patterns were different from previous years. Thanks for reading!
-
Wait, what? Why would you be getting YouTube video streams recorded and messing up your data? Because there is a web scrobbler extension that I use to scrobble my listening activity in SoundCloud, YouTube, and Bandcamp. Unfortunately for my data, it’s a bit overzealous and logs videos like those from Mentour Pilot as tracks in my Last.fm history.
I cleaned these up by searching for known bad data (artist=“Mentour Pilot”) in my Last.fm data in Splunk, as well as by sorting all track names in my listening history by length and removing the anomalies. I realized that YouTube videos often have long detailed names for algorithm optimization purposes, while music tracks don’t often have a name longer than, say, 20 characters.
Using Splunk to do the math, the average track name length for all tracks that I listened to this year is 18 characters. I also looked into the longest track names that I listened to in 2022. Excluding a couple malformed data points, Lil Nas X’s track “MONTERO (Call Me By Your Name) (But Lil Nas X Makes All The Sounds With His Mouth)” is the longest at 82 characters. Most of the other long track names are remixes. The shortest track name is 1 character: Super Flu’s track 1. ↩︎
-
Using a rough calculation that uses the track length from iTunes, if I had the track in my library, or 4 minutes if I didn’t, as evidenced in this Splunk search using an
evalcoalesce function:`lastfm` | eval exclude=if(uts>=1654688186 AND uts<=1654723907, "true", "false") | search exclude=false | fields track_name,artist | lookup itunestracklength.csv track_name OUTPUT track_length | eval length=coalesce(track_length,240000) | stats count, values(length) as duration by track_name,artist | eval total_time=(duration*count) | eval mins=round('total_time'/60000,2) | stats sum(total_time) as real_total | eval total_artist_time=round(real_total/60000)Four minutes is represented as milliseconds, to match the duration that I derived from my iTunes data and simplify my math. ↩︎
-
According to the following calculation, which uses the metadata from my iTunes library to supply the track length for the Fred again.. songs, because I own his discography:
`lastfm`
| eval exclude=if(uts>=1654688186 AND uts<=1654723907, "true", "false")
| search exclude=false
| fields track_name,artist
| lookup itunestracklength.csv track_name OUTPUT track_length,ui_track_length
| search track_length=* artist="Fred again.."
| stats count, values(track_length) as duration by track_name
| eval total_time=(duration*count)
| stats sum(total_time) as real_total
| eval total_fred_time=round(real_total/60000)
This isn’t necessarily the most efficient way to do the search, but it works. It also excludes a morning of bad data from the results. ↩︎
-
I keep a lookup that identifies the first time a track appeared in my Last.fm listening history, which has existed since 2007. Based on that data, I can then calculate when I first discovered a track. If I use that data then I can see which songs I discovered in 2022 and also listened to in 2022, compared to listening to tracks from before then.
index=music sourcetype="lastfm*"
| dedup uts
| lookup earliestlistens.csv artist OUTPUT year as earliestyear
| eval thisyear=if(earliestyear==2022, "exploration", "familiar")
| stats count by thisyear
It’s a pretty simple but helpful way to identify music discovery patterns. ↩︎
-
If you want to read further about the music industry definition of catalog, see Does the music industry’s definition of ‘catalogue’ need an upgrade? on Music Business Worldwide. ↩︎
-
I can correlate my Last.fm listening activity for the given time period with the release date information from my iTunes library, which I pull out in an automated fashion into a lookup to make it easier to correlate with event data. I used the epoch timestamp for April 30, 2021 as the stand-in for the catalog cutoff, 18 months before October 31, 2022.
`lastfm`
| fields track_name,artist
| lookup track_release.csv track_name, artist OUTPUT release_date
| search release_date=*
| eval newness=if(release_date>1619784000, "new", "old")
| stats count by newness
I considered picking a random release date to assign to all the unknown tracks, but imputing that data would be extremely difficult to do in a reliable or accurate sense. If you have any ideas, please let me know! ↩︎
-
I do this by separating all of my listening activity into 20-minute-long bins, then counting the track names in each bin. For any bin where I listened to the same track more than once, I deemed that “loyalty” to a track, otherwise my listening activity was deemed variety-seeking.
`lastfm` |  eval exclude=if(uts>=1654688186 AND uts<=1654723907, "true", "false")
    | search exclude=false
    | bin _time span=20m
| stats count by track_name,_time
| eval habit=if(count>1, "loyal", "variety")
| stats count by habit
After I determined whether I was loyal to a specific track during a given time window, I counted each instance of loyalty or variety (one for each track_name within a given time window) and graphed it. ↩︎
-
Expanding on the previous search, I looked for only the tracks that I was loyal to, and sorted by count and time window:
`lasfm`
| eval exclude=if(uts>=1654688186 AND uts<=1654723907, "true", "false") | search exclude=false
| bin _time span=20m
| stats count by track_name,_time
| eval habit=if(count>1, "loyal", "variety")
| search habit=loyal
| sort -count, _time
Unfortunately, this mostly revealed a lot of data errors with the way the Last.fm mobile app records and submits data. A lot of my “most loyal” time windows were a result of double or triple scrobble submissions by the mobile app. I’m still digging into the cause of that but I think it’s related to how Apple Music stores the “listening history” on the device. ↩︎