Music trends and data errors: 2022 in music
In 2022, I had no true “obsessions” in my music listening, unlike last year. Instead of any standout artists, I flitted from artist to artist as they released new albums or other things prompted me to rediscover how much I enjoyed their music.
This was a year for breadth, rather than depth, and also for discovering the limits of my music data collection mechanisms.
If you want to skip around, here’s a table of contents:
Top artists of 2022 #
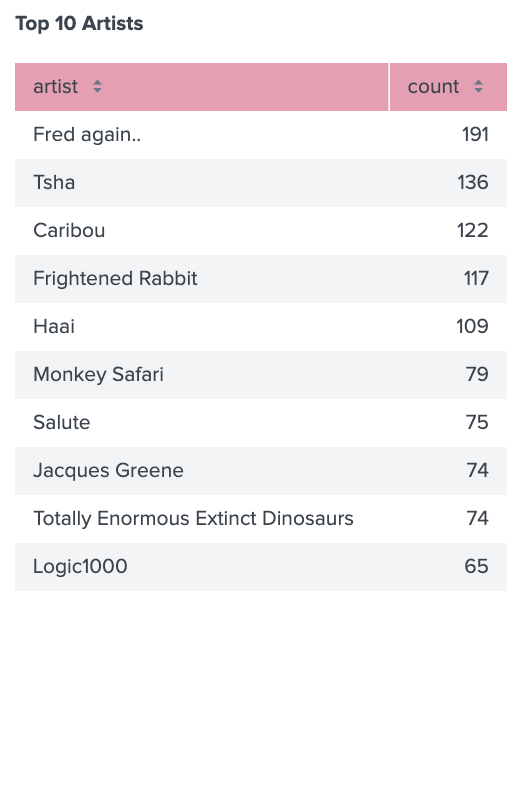
My top artists of 2022 had a lot of familiar names.
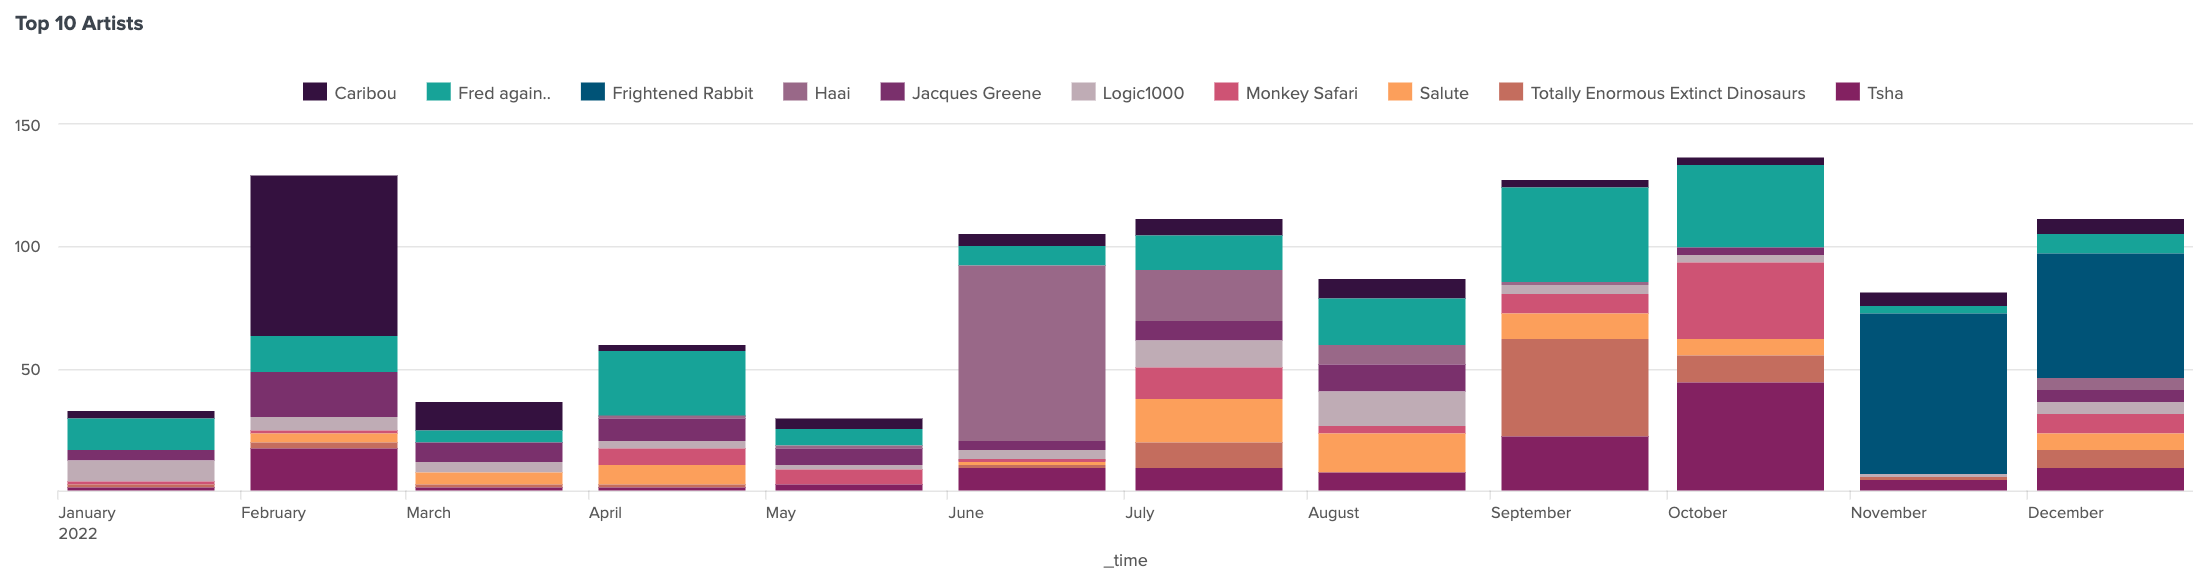
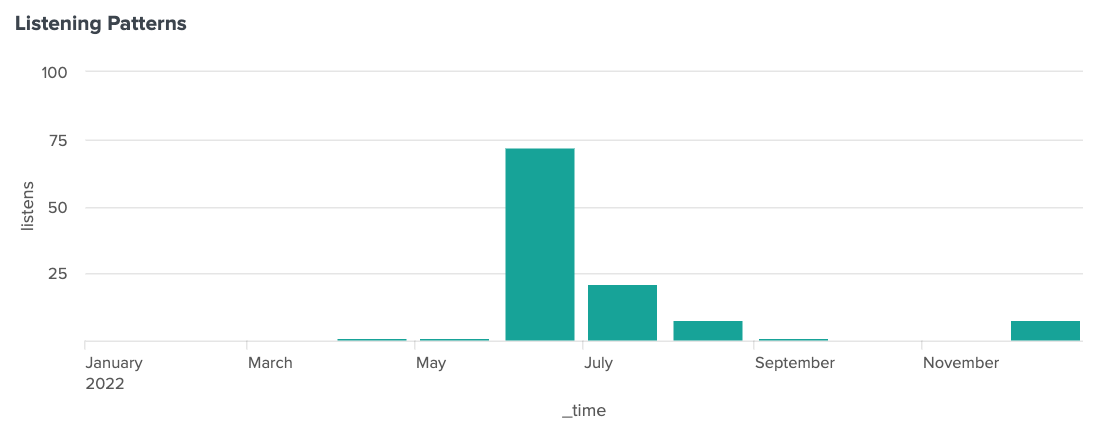
Rather than any one consistent artist, the real pattern was one of shifting obsessions. Let’s zoom in.
February: Caribou #
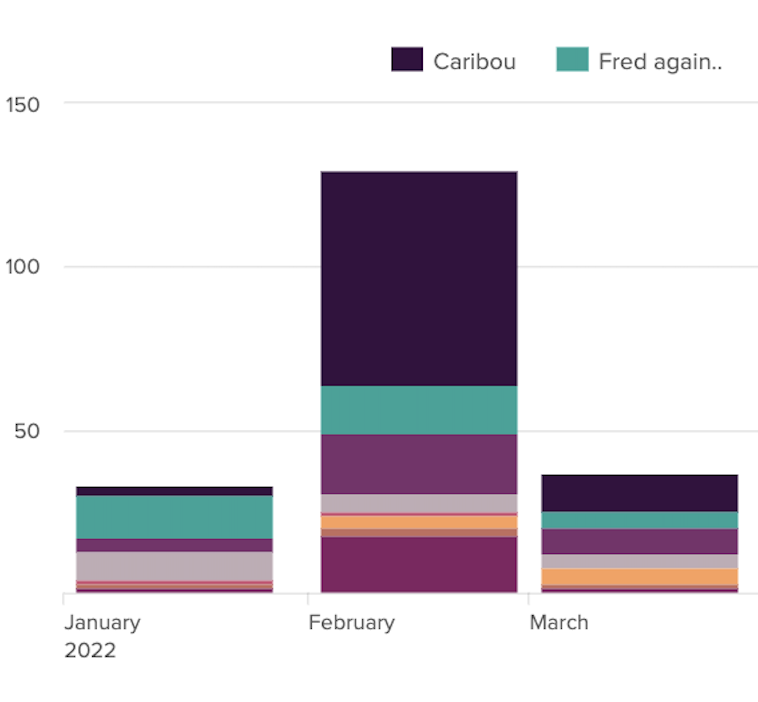
When 2022 kicked off, I barely listened to Caribou. I listened to 3 songs in January. In February, I went to their concert on a Wednesday at the Fox Theater.
Their live show blew me out of the water. I was entranced, captive to the flow of the music as they played Sun for what felt like twice as long as the studio track duration. In an attempt to recapture that feeling, I listened to Caribou a lot in the weeks after the show, and as a result they ended up one of my most-consistently listened to artists of 2022.
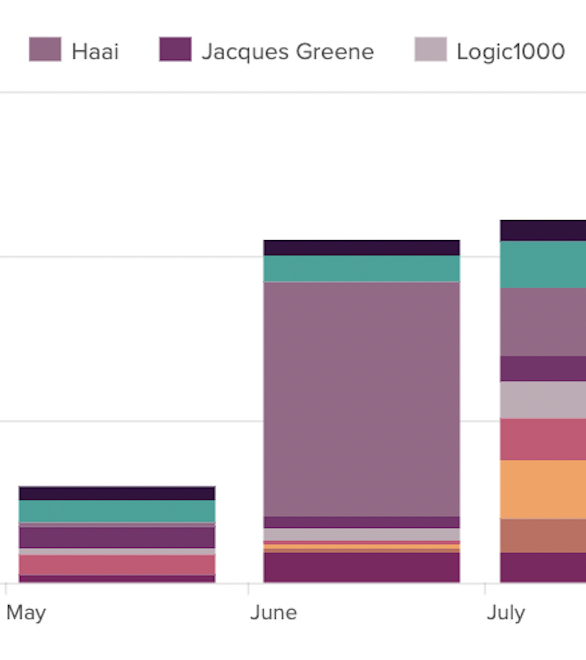
June: HAAi #
I discovered HAAi on October 08, 2018, listening to her track Be Good. I have no recollection of this, but the track is familiar to me. I didn’t listen to any new tracks by her until 2020, but the next one I heard, FEELS, was one I’ve since listened to 26 times.
Nevertheless, when I heard that she was coming out with a debut album, and it was produced with Jon Hopkins, I was thrilled.
The audio for her single from the eponymous album, Baby We’re Ascending, was released on May 4, 2022, and the music video was released on June 1st.
HAAi’s debut album came out on May 27, 2022, and on June 1st and June 2nd, I listened to the whole album all the way through.
I added her album to my library on June 8, 2022, and on June 18th, I listened to HAAi tracks 34 times. Judging by the frequency of listens on that day, there was also a data error afflicting those results, but I listened to the album all the way through at least once that day.
September and October: TSHA #
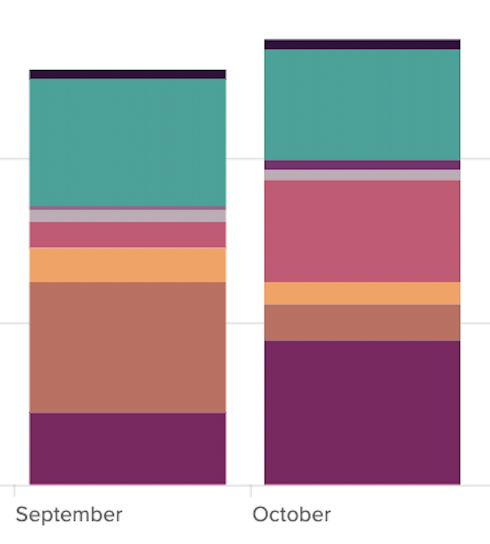
Not as prominent as other months and other obsessions, I still spent a lot of time listening to TSHA in September and October this year.
TSHA is another artist that I listened to quite a bit over the last couple of years, but didn’t yet have a full album out. She released her highly anticipated (at least by me) debut album Capricorn Sun in October, and it quickly went into strong rotation for me.
Three of my top 10 songs of the year are TSHA tracks, and she was one of the artists that I listened to at least once every month this year. I finally saw her DJ for a bit at Portola Music Festival, but I can’t wait to see her throw down for a headlining set.
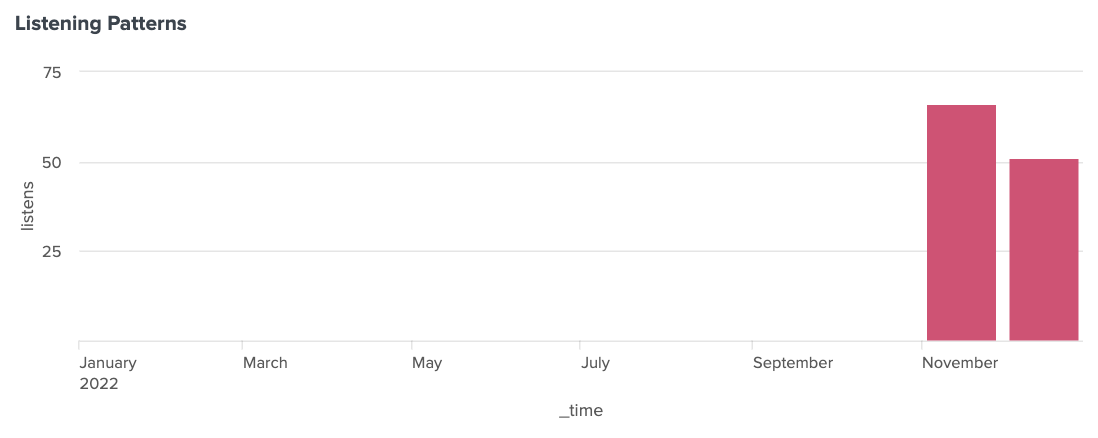
November: Frightened Rabbit #
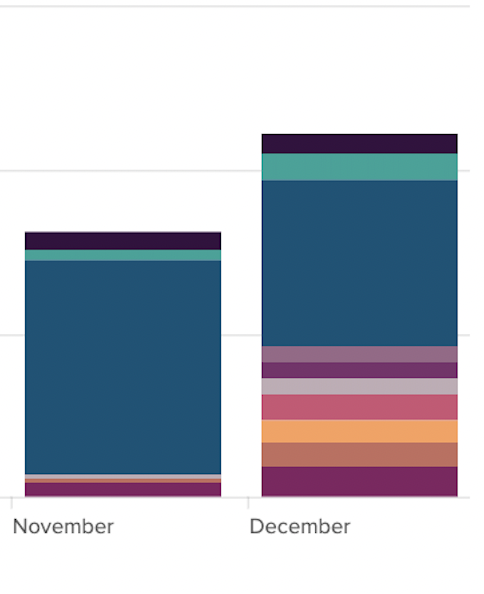
Frightened Rabbit is a band I’ve listened to for a long time.
The first song of theirs that I added to my iTunes library was Last Tango in Brooklyn, off a demo album, on October 1, 2009. That was also the first track I heard of theirs, on Sunday, November 15, 2009. However, I haven’t listened to them in a while.
So what prompted me to start listening to them again in November, and with such fervor?
I updated my podcast feed.
A friend of mine had recommended the Object of Sound podcast, with Hanif Abdurraqib, a poet and essayist that he was a fan of. I’d added the podcast to my feed but hadn’t yet listened to it, and in early November I updated my podcast feed and saw the episode for When It’s All Gone, Something Carries On (A Tribute to Scott Hutchison).
That episode was released on November 4, 2022, and seeing that podcast in my feed, prompted me to revisit their music.
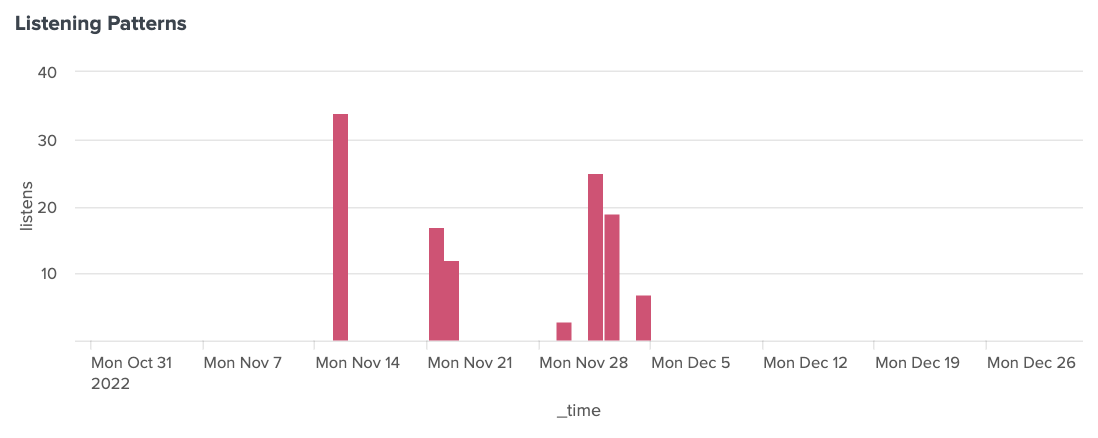
Subsequently, I listened to Frightened Rabbit intensely throughout November. I listened to Spotify albums downloaded offline for the entire 6+ hour flight back from my Thanksgiving travels, so that isn’t reflected in the data for November 29.
I finally listened to the podcast on the bus to the airport on November 29, and it moved me so much that I cried.
I kept up the intensity of my listening for a few days into December, but since then, the intensity of my listening has dwindled.
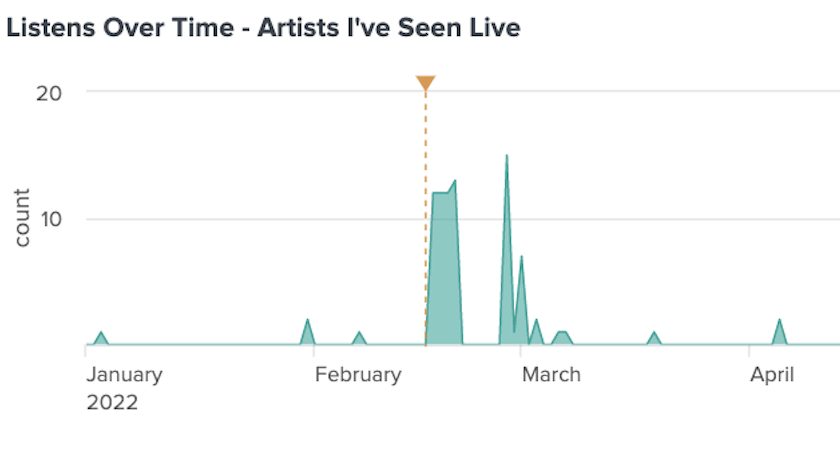
For reference and comparison, I saw Frightened Rabbit live in 2013, long before their frontman died, and my post-concert peak listening was 13 times in one day.
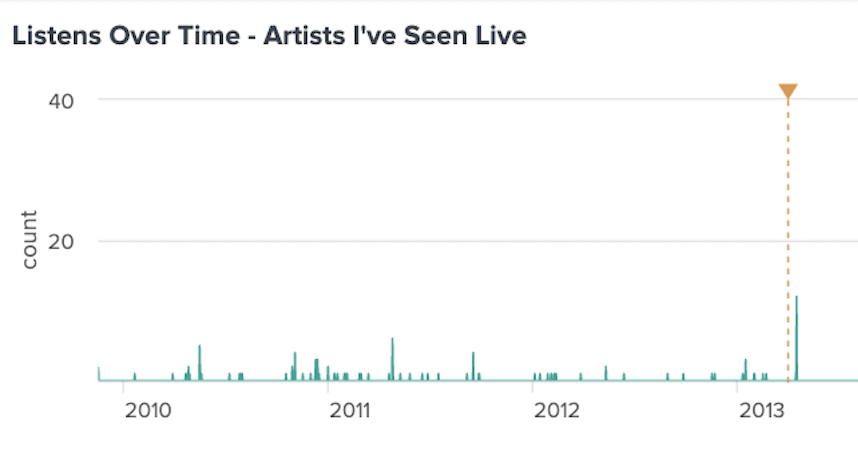
All of those days of listens are overshadowed by my listening patterns in November and December this year.
Another mini obsession: Hadiya George #
Beyond those three notable artist-of-the-month interludes, I had another intense listening stretch that wasn’t notable enough to make it to the top 10 artists, but did crack the top 10 songs.
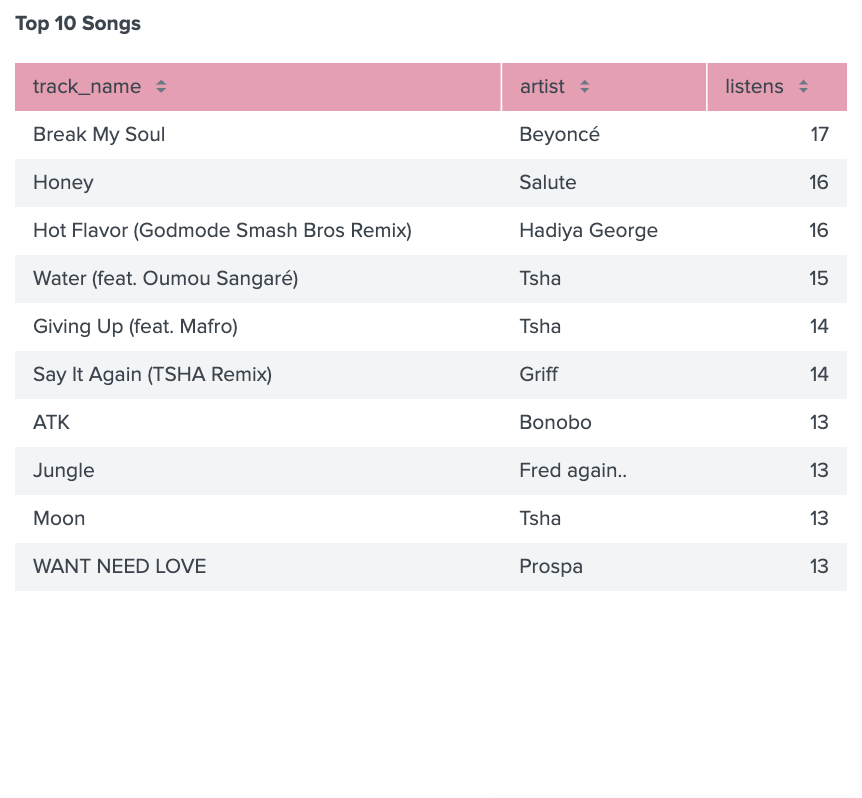
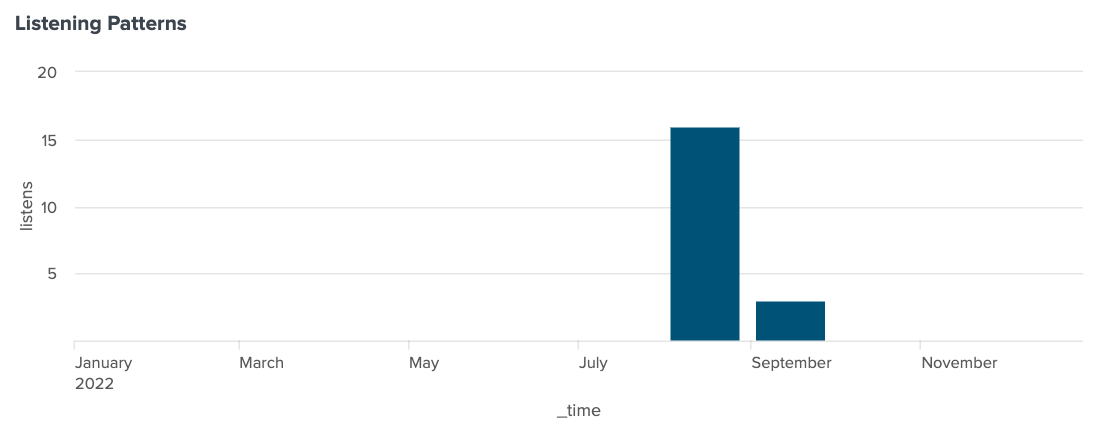
Hadiya George’s track Hot Flavor, remixed by Godmode Smash Brothers, was one of my top tracks of the year.
I discovered the track on August 21, 2022, and then listened to it 14 times the next day. Over the next couple of months I listened to that track, or the extended remix, once a day on 4 occasions. And that’s it!
As far as I can discern, I discovered the track on SoundCloud, liking it and reposting it the first day I heard it. August 21st is a Sunday, and SoundCloud Weekly refreshes late on Sunday night for me, so presumably that’s where I heard it for the first time.
It’s also possible that the track ended up in the autoplay recommendations when I listened to Carly Rae Jepsen’s track Beach House at the suggestion of a friend. I find that SoundCloud’s autoplay is pretty unmatched, at least for my music taste.
I listened to the track mostly on YouTube, because that’s the only place I could find the track, forgetting that I had discovered it on SoundCloud.
Eventually I purchased the extended version, and that’s where the listens at the end of September came from.
Consistent favorites #
In addition to the moments when I dug deep into an artist’s catalog, I had some standby favorites of the year.
salute #
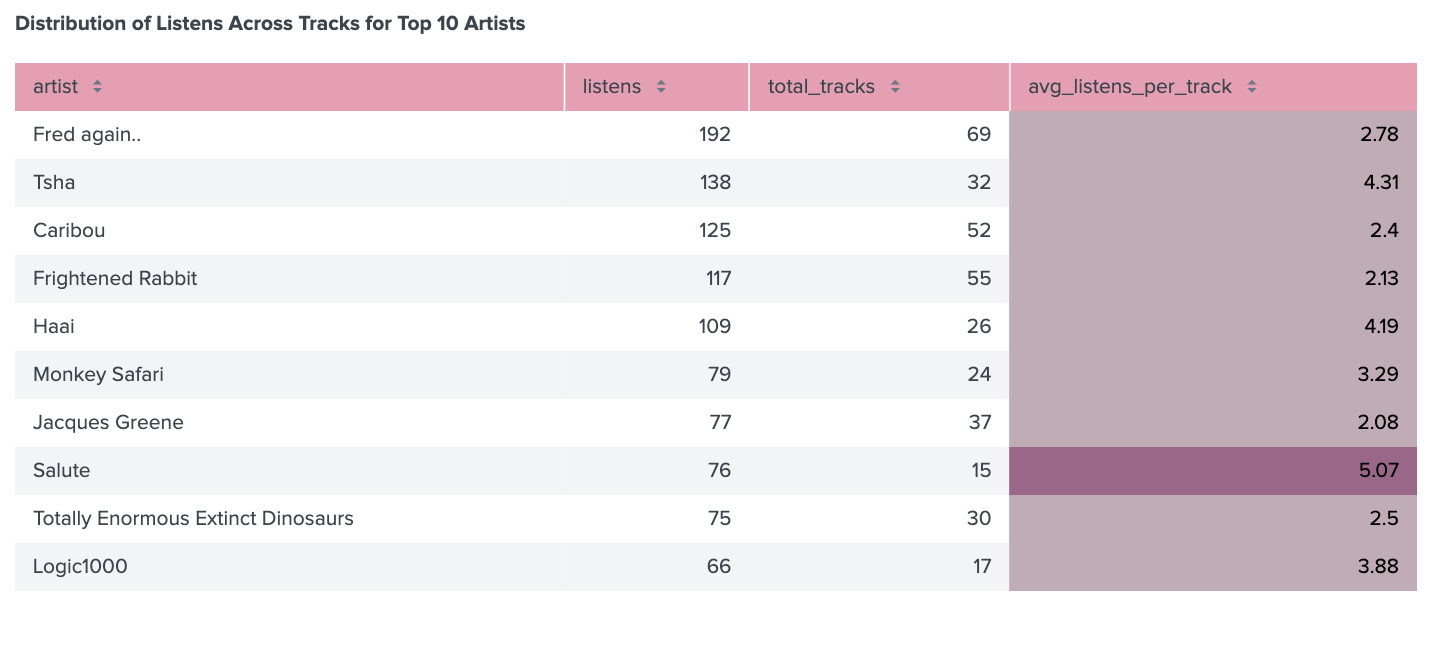
The producer and artist salute was one of my favorite artists of 2022. My eighth-most-listened-to artist of the year, those listens were concentrated on just 15 tracks, making him an outlier in terms of intensity of my listening activity for the top 10 artists.
In addition to making an appearance on my top 10 artists, he also made an appearance on my top songs, with his track Honey being my second-most-listened-to track of the year. He doesn’t have an album out yet, otherwise he might have shown up there as well.
I didn’t listen to salute every month of the year, but I enjoyed his music all the same.
I first discovered him in June 05, 2017 15:28:03, with a track called Weigh it Up (featuring Krrum). I have to imagine it was on Spotify, because while salute is great, this track isn’t really my style. Spotify put another track from salute on my Discover Weekly the next month, his track Light Up, which has a similar high production vibe that is more typical of standard EDM.
The first track of his to really kick, for me, was Want U There, which I first heard last summer June 29, 2021 10:35:05, which has a much more UK garage backbeat and vibe.
Fred Again.. #
My top artist of last year, Fred was also my top artist this year—but by a much slimmer margin than last year.
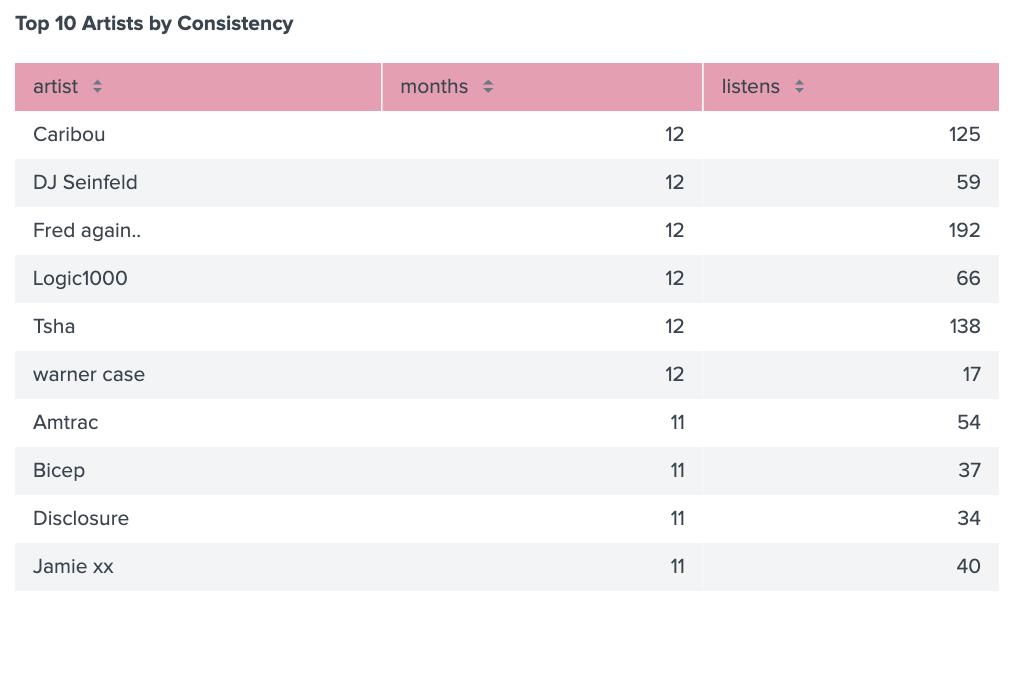
He was one of six artists that I listened to every month this year, joining Caribou, DJ Seinfeld, Logic1000, TSHA, and warner case.
On the other hand, I only saw him live once despite him playing San Francisco 3 times this year. I was underwhelmed by his first live appearance the weekend before Coachella, despite being stoked enough to show up early and stake out a front row spot at Great American Music Hall.
Having 3 albums out certainly helped him beat out the other contenders for top artist in terms of sheer output—the 193 total listens for this year are spread across 69 different tracks.
Most of my listening activity was concentrated in September and October, when his third album, Actual Life 3, was released.
Logic1000 #
Logic1000 making a stealth top 10 appearance. I didn’t consciously listen to her this year, but she squeaked in as one of my most consistently listened to artists of the year as well.
She came out with a few new tracks this year that I enjoyed, notably Rush and Can’t Stop Thinking About.
I also added 2 of my favorite songs of hers, YourLove and Safe in My Arms, to my library this year. Given that I moved away from listening to music on Spotify this year, that helped as well.
She joins salute in the list of artists that I’m hoping releases an album soon, but in the meantime I’m enjoying her singles.
I had plans to see her play earlier this year, but she cancelled her entire tour hours before I was supposed to see her. I hope she’s well.
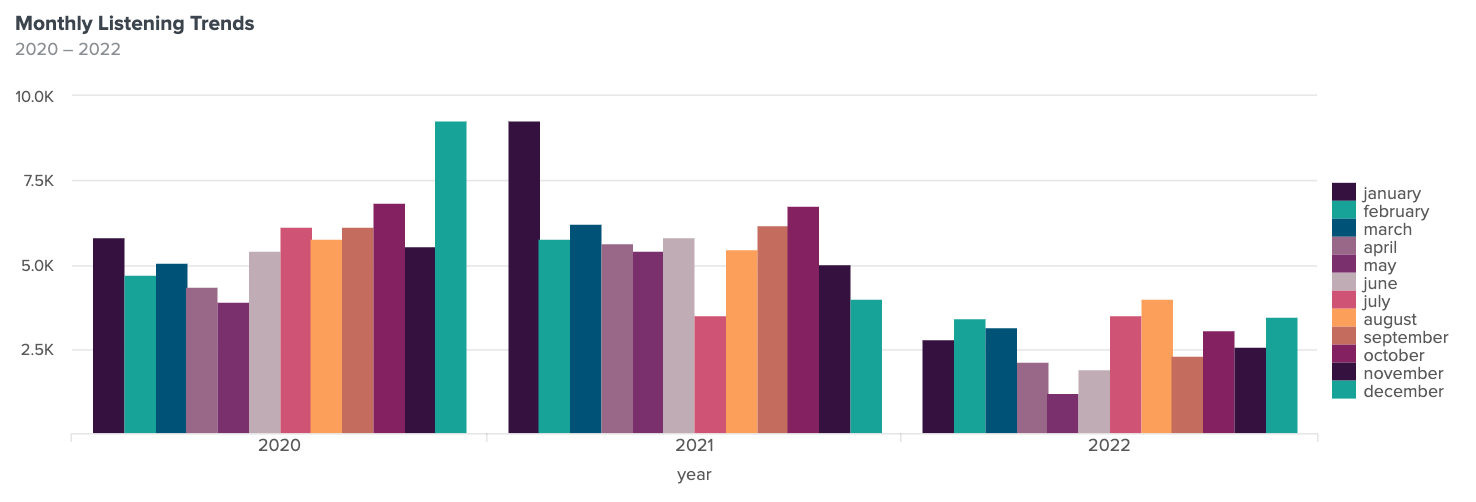
Listening habits over time #
As I mentioned in my Spotify Wrapped post this year, I made a concerted effort to diversify where I was listening to music. I took some time off from working this year, and that also contributed to changes in my listening behavior this year.
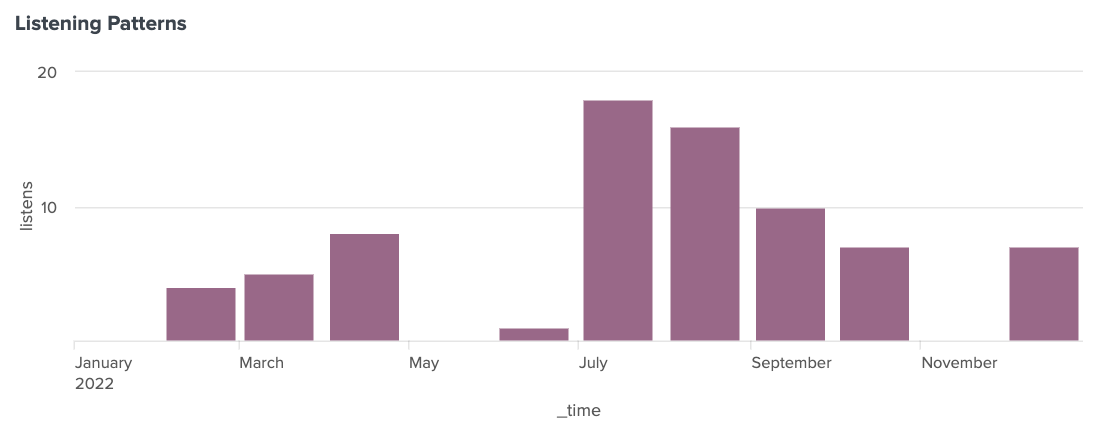
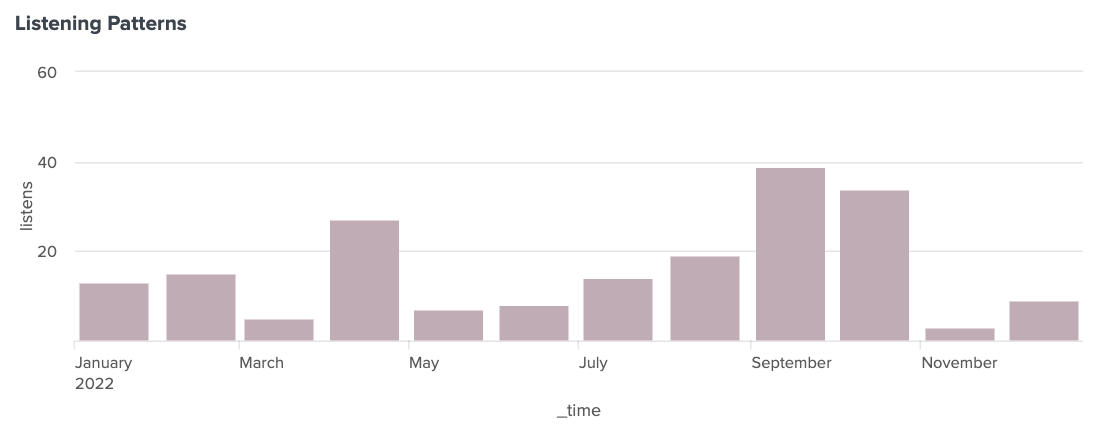
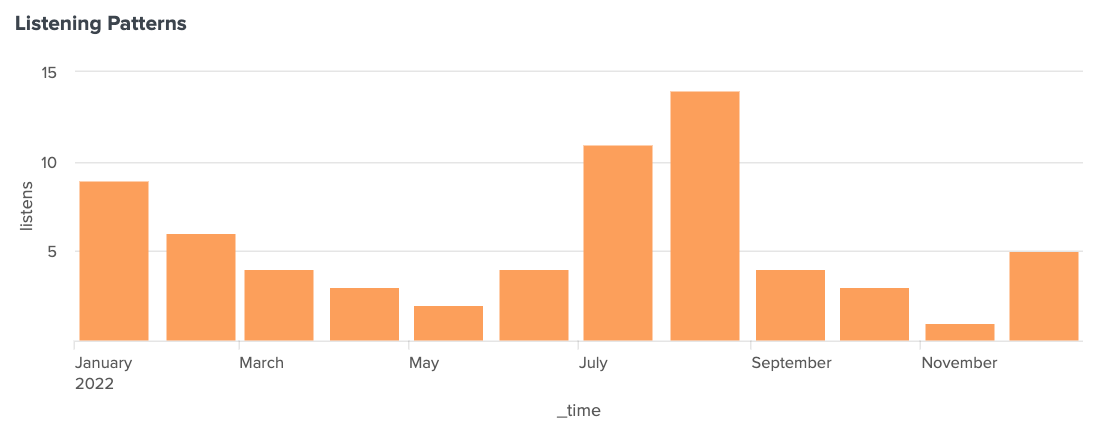
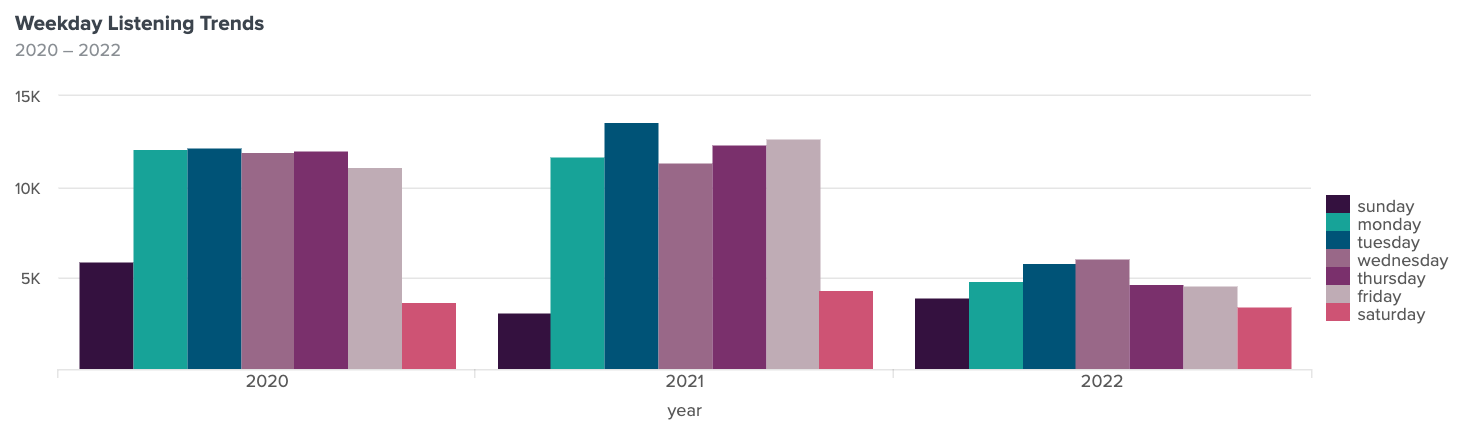
In general, the amount of time I spent listening was greatly reduced this year, most notably removed from the workday.
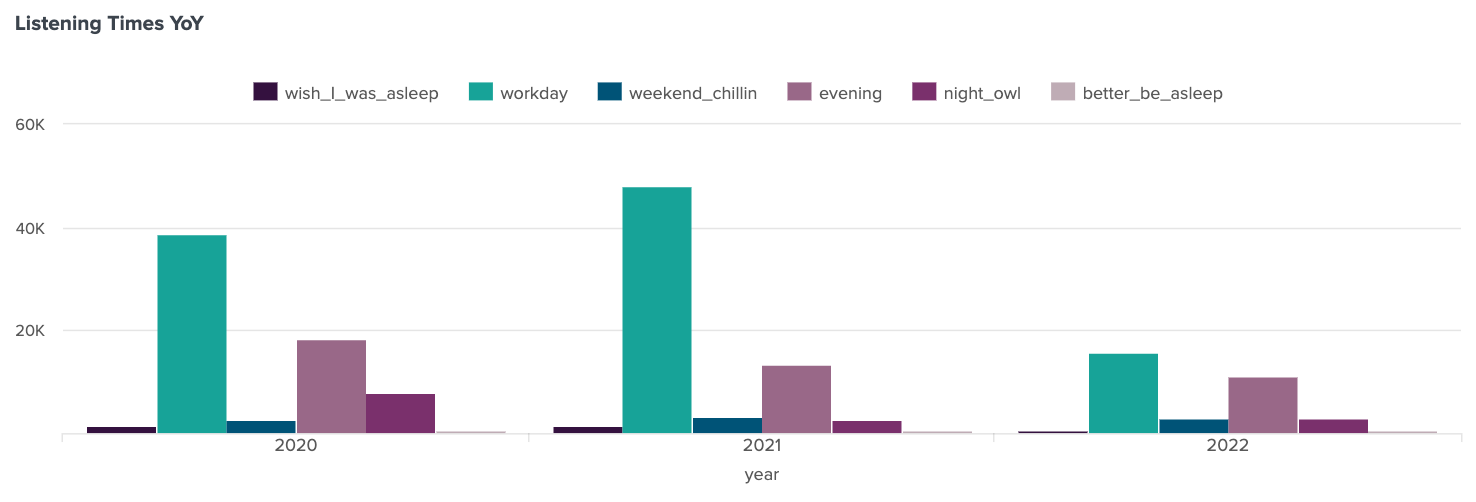
Overall, my daily listening habits flattened, no longer spiking on the weekdays while I filled my time with music while working.
While my overall listening volume is lower, you can also see the dip mid-year, when I’m working less. That coincided with moving in with my partner, a pattern that in the past has led me to listen to less music in general.
Where did my money go? #
This year, I wanted to put some more effort into figuring out who gets paid when I’m listening to music. It’s still a rough estimate, since I don’t know how much of my listening activity happened in which platform, but it’s something.
If I assume a $1 average price paid per song, this chart shows the amount that artists earned for purchases that I made on Bandcamp, and for purchases that I made on the iTunes store.
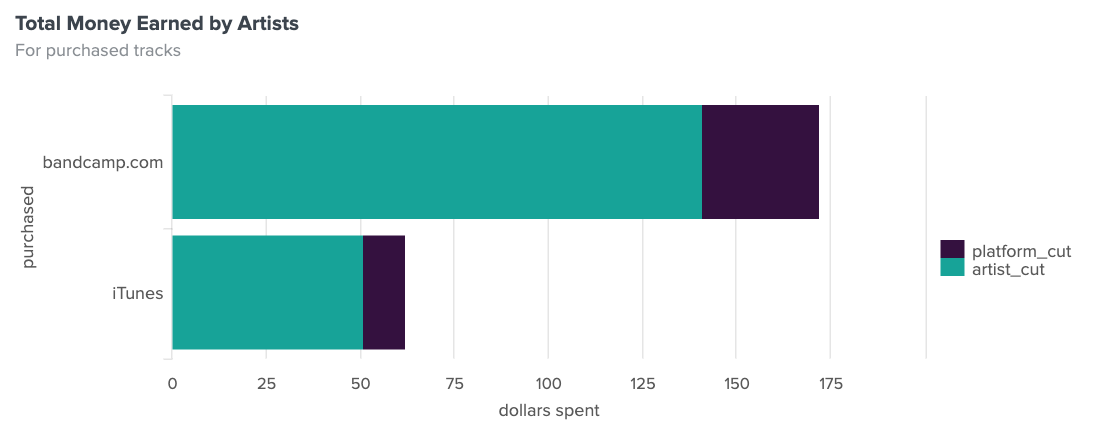
While Bandcamp is extremely transparent about how much money they pass on to artists, every other platform is more opaque and steeped in layers of “it depends”. For the purchase calculations, I’m assuming 82% of the price is passed on to the artists when purchased from Bandcamp.
For iTunes, I’m assuming that 70% of the payment is passed to artists when I buy a track from the iTunes store. I relied on an article from The Guardian How much do musicians really make from Spotify, iTunes and YouTube?, published in 2015, for the iTunes rate details.
In an attempt to determine how much money artists earned from my streaming behavior, I charted out the amount artists would earn if all of my listens for the year occurred on a given service.
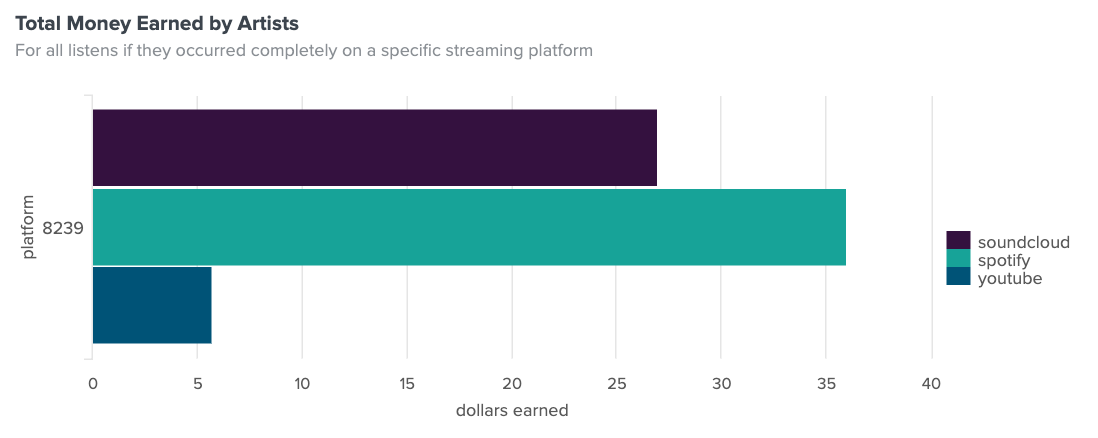
For the royalty rates from streaming services, I relied on the Streaming Royalty Calculator from Omari MC, which gave the following rates:
- 0.00437 for Spotify
- 0.00069 for YouTube
- 0.003275 for SoundCloud
All streaming rates end up being approximations, because the actual payout depends on the revenue for the streaming service, the share of an artist’s listens compared to total listens at the streaming service, as well as any negotiations made by the artist’s record label with the streaming service, if applicable.
While streaming revenue is recurring revenue, it’s wildly lower than the revenue that artists get when someone buys their music. Given that I still use streaming services, I think it’s a great idea to continue purchasing music.
Data errors and my top song of the year #
When I first went through this analysis of my music habits, I discovered that my top song of the year was Quiet Little Voices by We Were Promised Jetpacks.
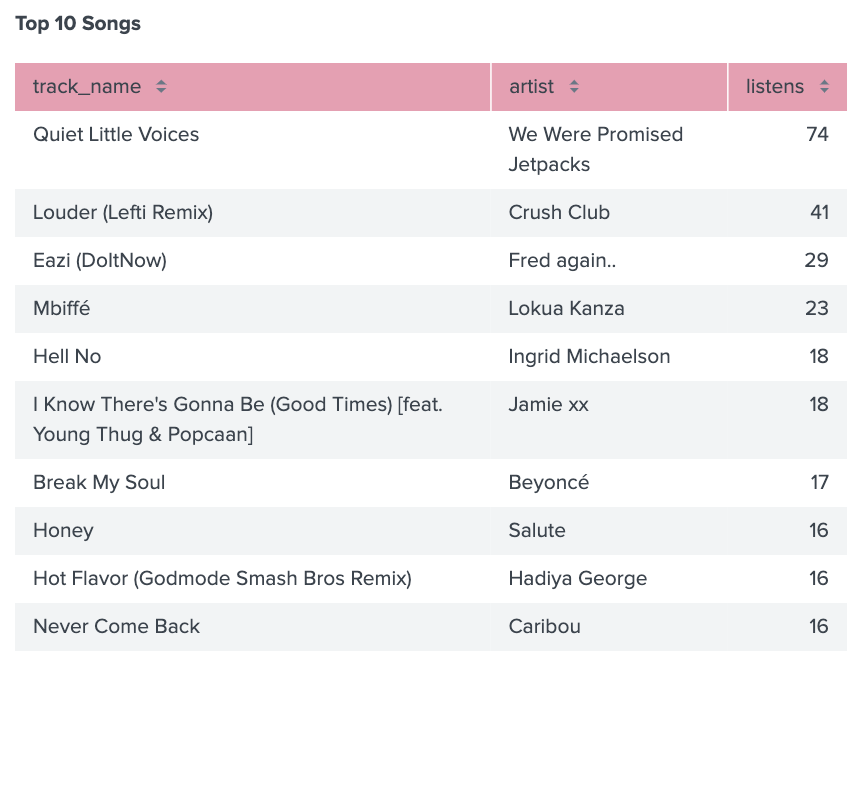
This was a bit of a surprise, because while I love that song, it isn’t one I had a strong memory of listening to frequently, let alone more than any other song of the year. So I dug a bit deeper, and that’s where things started to fall apart.
It turned out that all the scrobbles for that track were on June 8, 2022. On that Wednesday morning, I took the bus to an appointment, walked to the gym for a workout, then took the bus home.
According to my data, while I did that I listened exclusively to Quiet Little Voices on repeat from 4:30AM until 8:20AM, and then I rotated Fred Again..’s track Eazi (Do it Now) and Jamie xx’s track I Know There’s Gonna Be (Good Times) [feat. Young Thug and Popcaan] into the mix from 8:30AM until 10:00AM.
Starting at 11:00AM until 2:30PM I followed a similar pattern of listening to 7 different songs at impossible frequencies.
Why was this impossible?
In order to count a track as a listen (scrobble, in Last.fm parlance), the following needs to be true 1:
- The track must be longer than 30 seconds.
- And the track has been played for at least half its duration, or for 4 minutes (whichever occurs earlier.)
That means that according to the data, I was sometimes listening to as many as 5 songs in a 5-minute period. However, the shortest song I was ostensibly listening to is nearly 3 minutes long, and most tracks were at least 4 minutes or longer 2.
For those songs, I had a number of impossible track frequencies throughout the time period in the morning, and the second time period in the afternoon:
| track_name | listens |
|---|---|
| Quiet Little Voices | 73 |
| Louder (Lefti Remix) | 35 |
| Eazi (DoItNow) | 23 |
| Mbiffé | 20 |
| Hell No | 15 |
| I Know There’s Gonna Be (Good Times) [feat. Young Thug & Popcaan] | 13 |
| Never Come Back | 12 |
| Start Again | 7 |
| Inyani Feat.Oluhle & Aaaron | 3 |
| O’Flynn - SGD (Soundbwoy Killah Remix) | 3 |
| Sorry (Greene Edit) | 3 |
| exe.cute | 3 |
| Mir a nero (Original Mix) | 2 |
| For Sarah (Live DJ Mix) | 1 |
After I discovered this, I identified and excluded the data in Splunk 3 so that I could choose on a search-by-search basis whether to exclude this anomalous day from my data.
I thought that was the end of it — discovered a specific anomaly in the data on one day, remove that day from the data, and move on.
More errors than I realized #
A month later, I discovered that the problems went deeper than I thought. There were more errors beyond just this one day. As part of analyzing my music data to compare it with Spotify Wrapped, I determined whether I was habitually more loyal to songs (listening to the same songs frequently in a given time period) or sought out variety.
To do this, I collected my listening behavior into 20 minute bins and evaluated the number of repeated tracks in each bin, then counted the number of bins with repeated tracks (loyal) and different tracks (variety):
`lastfm` |  eval exclude=if(uts>=1654688186 AND uts<=1654723907, "true", "false")
    | search exclude=false
    | bin _time span=20m
| stats count by track_name,_time
| eval habit=if(count>1, "loyal", "variety")
| stats count by habit
After separating my listening habits into those 20 minute bins and assessing loyalty compared to variety, I wanted to know which tracks I was ostensibly loyal to:
`lastfm`
| eval exclude=if(uts>=1654688186 AND uts<=1654723907, "true", "false") | search exclude=false
| bin _time span=20m
| stats count by track_name,_time
| eval habit=if(count>1, "loyal", "variety")
| search habit=loyal
| sort -count, _time
And this is where the data errors show up. A lot of my “most loyal” tracks were seemingly double or triple scrobble submissions, almost certainly by the mobile scrobbling app, based on the times and days when the data collection errors occurred. I did a deep dive into why this might be happening 4, but I still wanted to see if I could consistently identify the data errors.
Based on an average track length of about 4 minutes, I first isolated the number of 20-minute bins that had more than 5 songs in them.
`lastfm`
| bin _time span=20m
| stats count, list(track_name) as tracks by_time
| search count >5
| sort -count, _time
There were a number of legitimate-seeming track patterns in those bins, so I narrowed it further to isolate the more improbable time periods wherein I listened to at least 7 songs in 20 minutes:
`lastfm`
| bin _time span=20m
| eval year = strftime(_time,"%Y")
| stats count, list(track_name) as tracks list(artist) as artist by _time, year
| search count >7
| sort -count,_time
I figured that any instances of 7 tracks scrobbled in a 20-minute period is almost certainly a data error. Given that most tracks I listen to are an average of 4 minutes long, 7 tracks in 20 minutes would mean that most tracks were 3 minutes each or less.
If I use an improbably high estimate of 8 songs per 20-minute bin, I can track down the worst of the worst bins over the years. If I focus on the last few years specifically, there’s quite a lot of issues:
| year | count |
|---|---|
| 2020 | 61 |
| 2021 | 84 |
| 2022 | 24 |
Oh no. Let’s see what the worst bin offenders were:
2021-11-27 17:20:00I ostensibly listened to 33 Fred again.. tracks. I was on an airplane, so it’s possible that I really did listen to all these tracks — just not in the same 20-minute period.2021-11-27 17:00:00has 28 songs recorded, also all by Fred Again.., 20 minutes earlier.
Looking at just the bins from 2022, the worst ones are part of the time period I identified on June 8:
2022-06-08 9:00:00I listened to 17 tracks.2022-06-08 13:40:00I listened to another 17 tracks.
This is disheartening, but also a relief that for this year, I’ve excluded the most egregious outliers in my analysis.
Can I trust the data? #
Back to the topic at hand—why am I digging into these data anomalies and errors at all? Because I use my Last.fm data to prop up my shoddy memory, I rely on it to reinforce or remind me about my favorite songs in a year.
If I can identify issues with the data based on statistical anomalies, and better yet, identify how the data is created so that I can trust my data. If I can understand how the data is created, I can improve its quality going forward, and clean up past data errors as well.
Last.fm recognizes the importance of high-quality data, and filters API requests sent to the scrobbling endpoint. Some relevant message codes:
- 3 : Timestamp too far in the past.
- 4 : Timestamp too far in the future.
- 5 : Max daily scrobbles exceeded.
They recognize that there are logical improbabilities in the data that would indicate errors upstream, and throw that data out.
In the case of my music data, I have two or three sources for listening data, or play count data, for a track:
- Last.fm
- iTunes metadata
- Spotify metadata
Each of these records a listen, or a play, slightly differently.
- Last.fm counts a scrobble for a song if it’s been played for at least half its duration, or for 4 minutes 1.
- iTunes play count is muddied with the Apple Music streaming service. Apple Music follows the same pattern as Spotify 5, but iTunes seemingly requires a song to be played in its entirety before it is counted as played for the play count 6.
- Spotify counts a stream for a song after someone listens for at least 30 seconds 7.
I don’t have any single ground truth measure to validate the data in Last.fm, but I can cobble something together from iTunes.
If I return to the first outlier track that led me down this rabbit hole, I can see that the overall play count for We Were Promised Jetpacks’ track Quiet Little Voices according to iTunes is 73. However, Last.fm lists the plays for that track for just this year alone as 74 plays, with 136 total plays.
This track has been in my iTunes library since 2009, so let’s go back in time. If I refer to a Library.XML file for my iTunes library from 2016, I can see that the play count for that track was 61:
<key>Play Count</key><integer>61</integer>
That’s more listens than Last.fm was aware of through that time, but Last.fm’s ability to scrobble music was much more rudimentary then. The bar to count something as a play in iTunes is also much higher than the threshold to count a track as scrobbled.
What caused this data error? #
There are patterns in the data discrepancies, or some likely attributions that I can come up with, like:
- scrobbling from mobile when it’s been awhile since I scanned for scrobbles using the app.
- scrobbling after a prolonged offline period of time, such as a plane flight
- listening on multiple data streams at once or overlapping, such as listening to Apple Music and Spotify at the same time, or the Spotify app and Spotify website at the same time.
- discrepancies with how developers that send data to Last.fm record a listen of a track, such as by scrobbling a track before the Last.fm definition of a scrobble is reached 8, which could explain another data bin that I discovered 9.
Ultimately, it feels like the more I dig, the more it feels like the listening data I have is like the points on the improvisational comedy show Whose Line is it Anyway: made up, and they don’t matter.
I track my music data for fun. From a data analysis perspective, it’s a challenge that there is no single source of truth that can provide “ground truth” accuracy for my music listening data, but it’s a great reminder that the same is true for most data sources in the world.
We rely on imperfect data collection methods to identify patterns and draw conclusions. It’s only by having a deep understanding of how the data came to exist, and audits throughout the analysis process, that we can be confident in the results of the data analysis.
2022 in music, and what’s in store for 2023? #
2022 was a unique year in music listening. My listening volume was down, my listening habits were spread across a lot of different services, but I still spent time with artists whose music I treasure. Here’s to more UK garage in 2023, some new albums from upcoming artists, and even more discoveries.
-
When is a scrobble a scrobble? in the Last.fm API documentation. ↩︎ ↩︎
-
The following table outlines the tracks and durations that I listened to during that time period:
↩︎track_name artist duration Quiet Little Voices We Were Promised Jetpacks 4:21 Louder (Lefti Remix) Crush Club 4:07 Eazi (DoItNow) Fred again.. 3:37 Mbiffé Lokua Kanza 4:02 Hell No Ingrid Michaelson 2:55 I Know There’s Gonna Be (Good Times) [feat. Young Thug & Popcaan] Jamie xx 3:34 Never Come Back Caribou 5:05 Start Again Kidnap 4:00 Inyani Feat.Oluhle & Aaaron Re.You 7:15 O’Flynn - SGD (Soundbwoy Killah Remix) Hundred Flowers Records 7:36 Sorry (Greene Edit) Jacques Greene 6:00 exe.cute Marc DePulse 6:55 Mir a nero (Original Mix) Michel Cleis 12:15 For Sarah (Live DJ Mix) Tourist 4:48 -
I wrote the following evaluation statement, and then searched for the data that didn’t match it:
| eval exclude=if(uts>=1654688186 AND uts<=1654723907, "true", "false")
| search exclude=false
This approach meant I could identify the erroneous data without automatically excluding it. ↩︎
-
I dug into alternate scrobbling apps, in case that was the issue, and discovered one called Eavescrob, which has an FAQ that includes the following note:
Due to the limitation of iOS system, iOS only keeps the last time point of a song you’ve played, so currently the repeated plays are timestamped based on your last played date. Let’s hope a better solution would come to iOS eventually.
And thus I had a kernel of information to attempt to track down. In an attempt to locate the Apple Music API endpoint or framework this information came from, I dug into the open source code for Finale, another Last.fm scrobbling app. I couldn’t find any leads, so I reached out to the developer on Twitter, and he was kind enough to point me to another repo, where he has the code for retrieving the information.
It turns out that the Apple Music API endpoint, get recently played tracks, is not the main source of information. Instead, it’s a Media Player framework which permits queries of specific media items that have been played. That lastPlayedDate variable confirms that the data that is collected is, in fact, the most recent play date for the item (rather than an array with the history). You can perform a query with any elements of an MPMediaItem. In the case of the Finale scrobbling app, the developer queries the songs and then filters them for those where the
lastPlayedDateis after a specific time.It’s always a challenge to use an API or a framework in a somewhat adjacent manner to which it has been intended, and this is likely a case where, if the framework had been designed to communicate all playback activity, that would be possible. But in the context of, say, writing a shuffle algorithm, and meeting more clear and internal product needs, the framework would only need to know how recently the track had been played — not the entire track playback history.
And so we hang out in the niche and acquire subpar data for our purposes.
Presuming that the Last.fm scrobbling app for iOS works the same way as the Finale app, or at least using the same framework, an issue with cached data, a malformed query, something else, or some combination of all of those that likely caused the data corruption on June 8 and other dates. ↩︎
-
“Plays are recorded when a user initiates song playback in Apple Music for more than 30 seconds.”, according to Understand your analytics in the Apple Music for Artists documentation. ↩︎
-
This is according to a discussion on Reddit, and another on StackExchange. The conversation on StackExchange from 2011 about What does “plays” really count in iTunes? points out:
play count == number of times the file played right to the very end.
The conversation on Reddit on the Apple Music subreddit, What counts as a “play count”? from 3 years ago affirms that: listening “Up to less than :10 of the song ending.” is what counts as a play in iTunes.
The official documentation for playCount in the Media Player framework and the MusicKit Library documentation is, as anticipated, vague and useless:
The number of times the user plays the media item.
or alternately:
The number of times the user played the song.
In my own experience, tested while writing this, I can confirm that the denizens of the internet forums are correct, and the play count on Apple Music, formerly known as iTunes, increments only when a song has been played in its entirety. ↩︎
-
“Song stream: Counted when someone listens for 30 seconds or more”, according to How we count streams in the Spotify for Artists documentation. ↩︎
-
See the earlier definition of what a scrobble is, according to Last.fm. It occurred to me as well that since Last.fm will send the “currently playing” track as well as the history of tracks played, that it could be an anomaly there, but I discard the “currently playing” events in the Last.fm Add-on for Splunk configuration, and I further deduplicate the data at search time by unix timestamp (uts) so if the timestamp matched exactly, I wouldn’t count duplicates. ↩︎
-
That last explanation is probably the case with a 20-minute bin from earlier this month,
2022-12-04 23:20:00, where I listened to these 8 tracks in a row:- Orbiting
- Can’t Go Back Now
- Takes so Long
- Antarctica
- Wish I Could Forget
- Thunder
- Hideaway
- Orbiting
Many or most of these songs are under 3 minutes long, which can explain why they nearly fit in a 20 minute time block:
track_name duration Orbiting 2:55 Can’t Go Back Now 2:18 Takes so Long 3:07 Antarctica 3:15 Wish I Could Forget 2:57 Thunder 3:24 Hideaway 2:47 All of these songs are by The Weepies, except for Thunder, which is a track by Imagine Dragons. I must’ve been playing Heardle in the middle of listening to a bunch of mopey folk songs by The Weepies, and listened to that on Spotify, which has a lower threshold for counting something as played than iTunes does. ↩︎