Where to start with analytics for documentation
It’s tough to find helpful information about analyzing website metrics for technical documentation sites.
The goals of technical documentation are different from those of a marketing blog or a company website. You’re not optimizing for maximum traffic. No one is clicking “Add to Cart” on your API reference topics.
You need to use slightly different metrics and in different ways than you might for a marketing blog or your company’s website.
If you want to start using site analytics with your documentation but aren’t sure where to start, this post is for you.
What are site analytics? #
Website analytics, in the context of this post, are the metrics collected about a user’s activity when they access a website—in this context, the website hosting your product documentation.
Those user metrics are then aggregated and made available as website analytics such as page views, unique users, average session length, page referrer, and more.
Typically, companies add analytics when they launch their websites, so your documentation site almost certainly has a tool like Google Analytics, Adobe Analytics, or a smaller provider like Hotjar set up.
Get a basic understanding of working with site analytics #
Start with these blog posts from Bob Watson:
Those blog posts are an excellent foundation for building a basic understanding of what site analytics mean.
Make sure to get familiar with the tool that you’re using to analyze the data1. If you’re focusing on one section of your documentation, learn how to filter the data so that you only see relevant values2.
You also want to look at site analytics with several months worth of data. For example, as Kumar Dhanagopal points out in his talk for Write the Docs Portland 2022, Don’t trust the numbers!, it’s more valuable to look at trends rather than absolute numbers.
With that in mind, don’t look at analytics for new pages until a few months have passed, to make sure the metrics are relevant and reflect a consistent pattern.
Start looking at your site analytics #
As tech writers, we’re frequently understaffed and overburdened. There’s always more writing to be done than we can tackle. Because of that, we need to be strategic.
Data can help when we’re trying to figure out how to do more work with our time.
Maybe these scenarios sound familiar:
- I have a lot of outdated content that I need to update, but where do I start?
- People keep asking questions in Slack and in forums that are answered in the documentation, but why can’t they find what they’re looking for?
- My boss wants to put all the documentation inside the product, but I’m not so sure.
Site analytics can help with these scenarios if you can ask specific, discrete, and data-focused questions of the data. In this way, website analytics function as imperfect proxies3 for the information that you actually want to know.
Define and refine your questions #
When you initially come up with a question, it might not be something you can answer with data. What you can do is refine what you want to know into a more data-focused question, and then identify which website analytics metrics might help you answer it.
| What you want to know | Data-focused question | Website analytics metric |
|---|---|---|
| What do people find useful? | Which pages are most popular? | Page views |
| Where should I start updating outdated content? | Which pages are most viewed? | Page views |
| Is the documentation easy to find? | How are people getting to the documentation? | Channel, referrer, and source |
| What do people want to know about the product? | What searches are leading people to my documentation? | Search terms |
| What portion of our overall user base uses the documentation? | How many users are viewing these pages? | Total users |
| Are people finding the information they need? Are they lost? | Are people clicking links and engaging with the documentation? | Click-through and engagement data |
Although these are data-focused questions, data is rarely, if ever, definitive. You can’t expect an obvious answer to any questions you ask of the data.
Instead, your goal is to reduce your uncertainty about the answer. When you ask a question about your documentation, such as “How are people getting to the documentation?”, you can make assumptions about the answers.
Maybe people are searching, using a browser bookmark, or opened a link from an email or chat message.
After you make assumptions, you can look at the data to reduce your uncertainty and validate or reject your assumptions.
Which pages are most popular or most viewed? #
If you want to know which pages are most popular or most viewed in your documentation, look at page views. Page views are exactly that — when someone views your page in a web browser.
How to look at page views #
Look at page views across different time scales, to identify which pages are consistently viewed, and which ones are frequently viewed.
If you look at the page views for a month, look at the previous month, and the same month last year, to help you get a sense of baseline page views.
As Bob Watson points out in How you can make sense of your site analytics, it’s important to understand the baseline number of page views for your documentation site, and use that baseline to evaluate outliers for the pages that you want to learn more about.
I prefer to use a bar chart or a table to look at page view data so that I can actually figure out what I’m looking at. Bar charts help me identify outliers at a glance, and tables give me easier to read data.
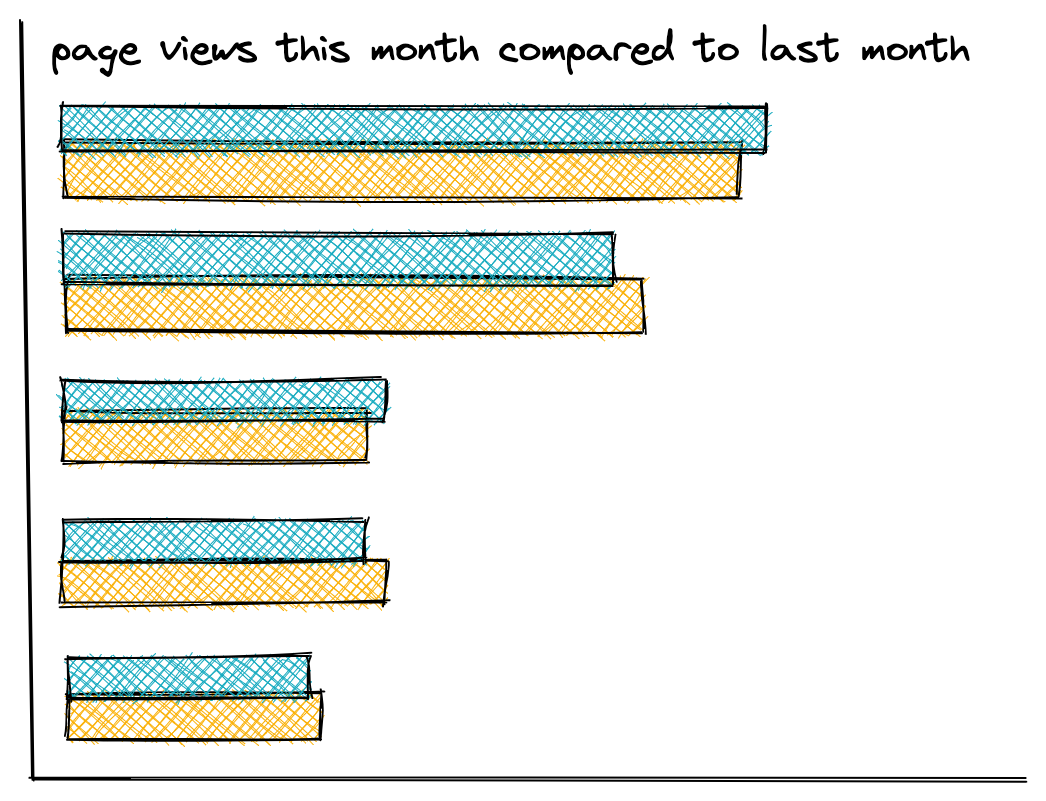
Ultimately, you’re checking the data against your expectations and a baseline.
Evaluate against your expectations #
You might see page views for a certain page spike during a week. This is when you start to add context and consider the possible causes of that spike:
- You could look at page referrers to see if your page is being shared somewhere like Hacker News or Reddit and going viral for some reason.
- You could also consider the product marketing and release schedule—if it’s a page related to a newly announced feature, it makes sense that the traffic would be higher than usual!
Beyond patterns in page views, I’d expect that the homepage for the documentation and a “quickstart” or “installation” topic are going to be the most-viewed and most-consistently viewed pages of your documentation. This might be true for you as well, but this is something else you can explore when you contextualize the data.
How are people getting to the documentation? #
If you want to know how people are getting to the documentation, there are several metrics that give you insight into this at different levels of granularity.
If you want to know which social sites, search sites, or other websites users are using to get to your documentation site, session source has that information.
The page referrer helps you find out what path to and through the documentation users are taking, if any.
What metrics to look at #
Channel data gives you information about the method that someone used to get to your documentation site. The following channels4 are common for documentation sites:
- Direct
- Organic search
- Referral
Session source is the disaggregated form of the default channel grouping. Looking at the session source combined with the medium lets you see both the channel and the specific site. For example:
| session source | medium |
|---|---|
| search | |
| search | bing |
| referral | t.co |
Use the page referrer metric if you want to know exactly which page sent users to your documentation. If you’re using Google Analytics 4, you’ll need to do some configuration5 to use it in reports.
Look for surprises #
When you’re looking at referrer data (whether it’s channel, session source, or page referrer), keep an eye out for surprising or unexpected sources of traffic.
You might discover that a company confluence page shows up as a frequent page referrer to your documentation. As part of contextualizing the data, you can find out whether that company is a customer of your product.
- If they’re a customer, you might want to find a way to reach out to them for a user research interview.
- If they’re not a customer, you might want to dig into what their company does to learn more about why they might be linking so frequently to your documentation.
What searches are leading people to the documentation? #
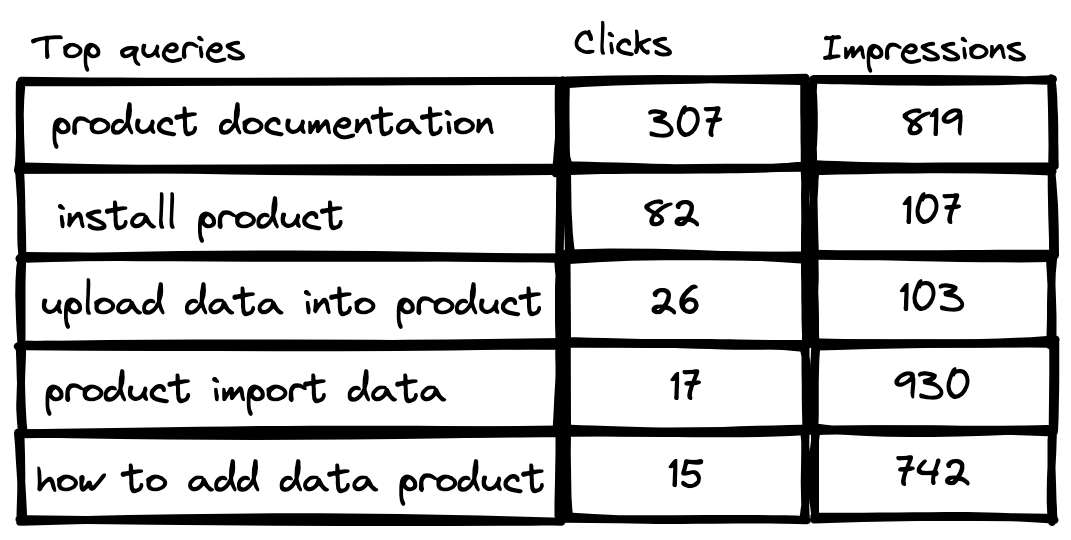
If you want to know which search terms lead people to the documentation, use search term data. It might seem obvious that search terms are a valuable source of information, but there is some nuance in terms of which search terms are available to you.
What search term data to look at #
The search terms collected by Google Analytics and similar tools are the terms used to search your documentation site while on your organization’s website. Search terms in Google Analytics are not search terms that users are typing into Google6.
Instead, to see search terms that users are typing into Google that might lead to your website, you need to use the Google Search Console. You can see up to 1000 search terms for which your pages made an appearance in Google Search results. If you spend some time and effort customizing Google Search Console, you can see more helpful data7.
What Google Search Console can’t offer you, besides the search terms that people use on other sites like Bing, Duck Duck Go, Baidu, or Yandex, is search terms in context with a user journey.
The search terms available in your analytics tool can be more useful because you can identify which terms led people to specific pages.
What to consider when using search term data #
Search terms are often more valuable for large documentation sets or products with a large user base, for the following reasons:
- The larger a documentation set, the harder it is to find information by browsing a table of contents, so more people will use search.
- The larger the user base, the more people will use search because you have more people using your website in general.
Because search terms are a proxy for what your users want to know more about, you can draw more relevant conclusions (or more confidently validate assumptions) when you have a high volume of search terms.
If your documentation set is about 10-30 pages, or you have a small user base for your product, you might not have many search terms, or enough search term traffic, to give you helpful information in search term data.
Evaluate your search results data #
When you evaluate your search results data, whether in analytics or in Google Search Console, you want to look for the following:
- What are the most consistently searched terms over time?
- What are the most frequently searched terms?
- What are the least-searched terms?
- What are the inconsistently searched terms over time?
If you have enough search term data, you can start to contextualize the data with other types of information.
You can identify successful searches, where a search term led users to a relevant documentation page, and unsuccessful searches, where a search term led to no engagement or led users to an irrelevant documentation page.
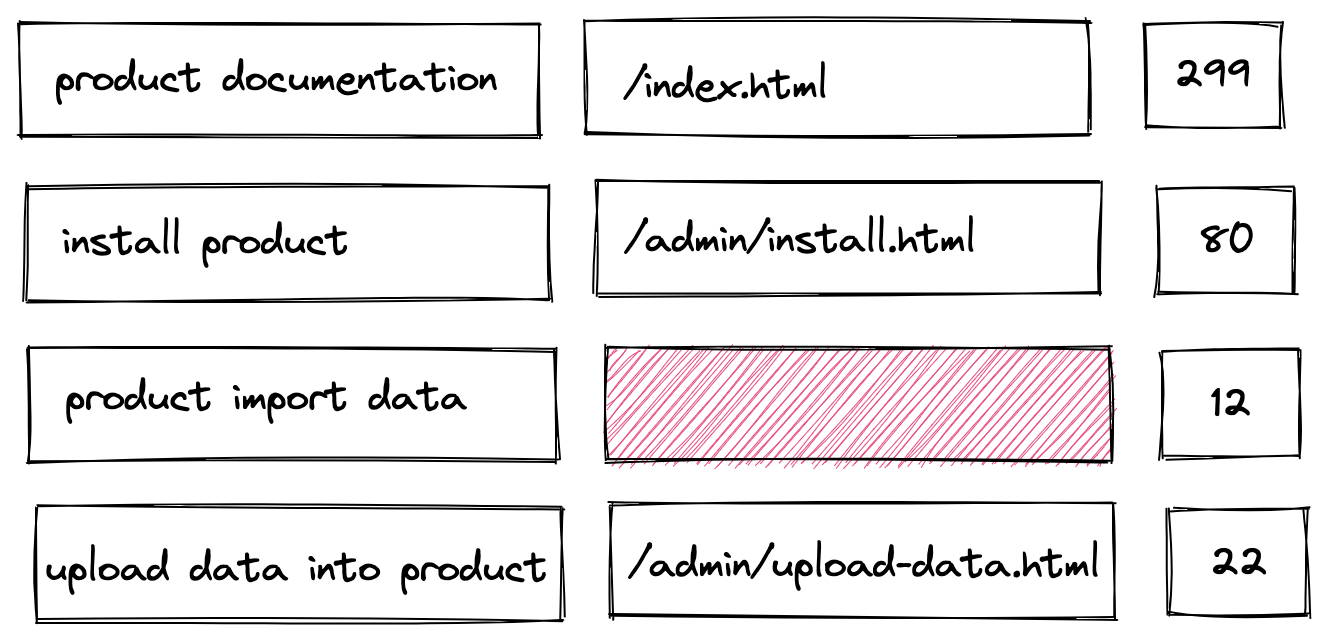
If you have a high volume of unsuccessful searches for a specific term or related group of terms, that might indicate an opportunity to write new documentation or recontextualize existing documentation to use similar terms that people are using to search.
A lack of terms in search that you might expect to see could indicate that users are finding content a different way — by navigating directly to it using bookmarks, or using the on-page navigation and landing pages rather than using search.
How many users are viewing these pages? #
To find out how many users are viewing the documentation, review the total and active users8 for your site. I’m intentionally referring to users viewing rather than reading the documentation, because we can’t know what anyone is doing when they’re on your page9.
While real time users is a metric calculated by Google Analytics, it’s not valuable as a documentation metric. Your documentation site is not an ecommerce platform attempting to convert viewers into purchasers or a SaaS app attempting to measure user activity for monetization purposes.
A high number of active users might indicate useful documentation because people are returning to it consistently. However, you can’t know why users are returning to the documentation without talking to them.
I find it more valuable to focus on total users and active users to get a sense for how many of your product customers are using the documentation when you contextualize the data.
Are people clicking links and engaging with the documentation? #
If you want to better understand whether people are clicking links and engaging with the documentation, you can look at click-through and engagement data.
What engagement metrics to look at #
Identify how people are engaging with your documentation with the following engagement metrics:
- Link URL tells you which links people clicked in your documentation, and how many times.
- Bounce rate tells you the percentage of sessions in which a user visited a page in your documentation and left that page within 10 seconds without doing anything.
- Average engagement time tells you the average amount of time, for a given time period, that someone viewed your documentation.
These definitions and names can vary by analytics tool, but the meanings are roughly the same.
Evaluate your engagement metrics #
To evaluate these metrics, look for outliers in activity and patterns, and consider your assumptions about user behavior.
When you look for outliers, you might look for the following:
- High numbers of clicks on specific links compare to other links.
- High time on page or engagement time compared to other pages.
- A high bounce rate for a page.
You also want to contextualize these outliers in terms of frequency and volume. If one or two people are bouncing off a page out of a total user cohort of 10K, that’s likely meaningless. If thousands of people are bouncing off one page in the same total user population, there’s probably something worth investigating.
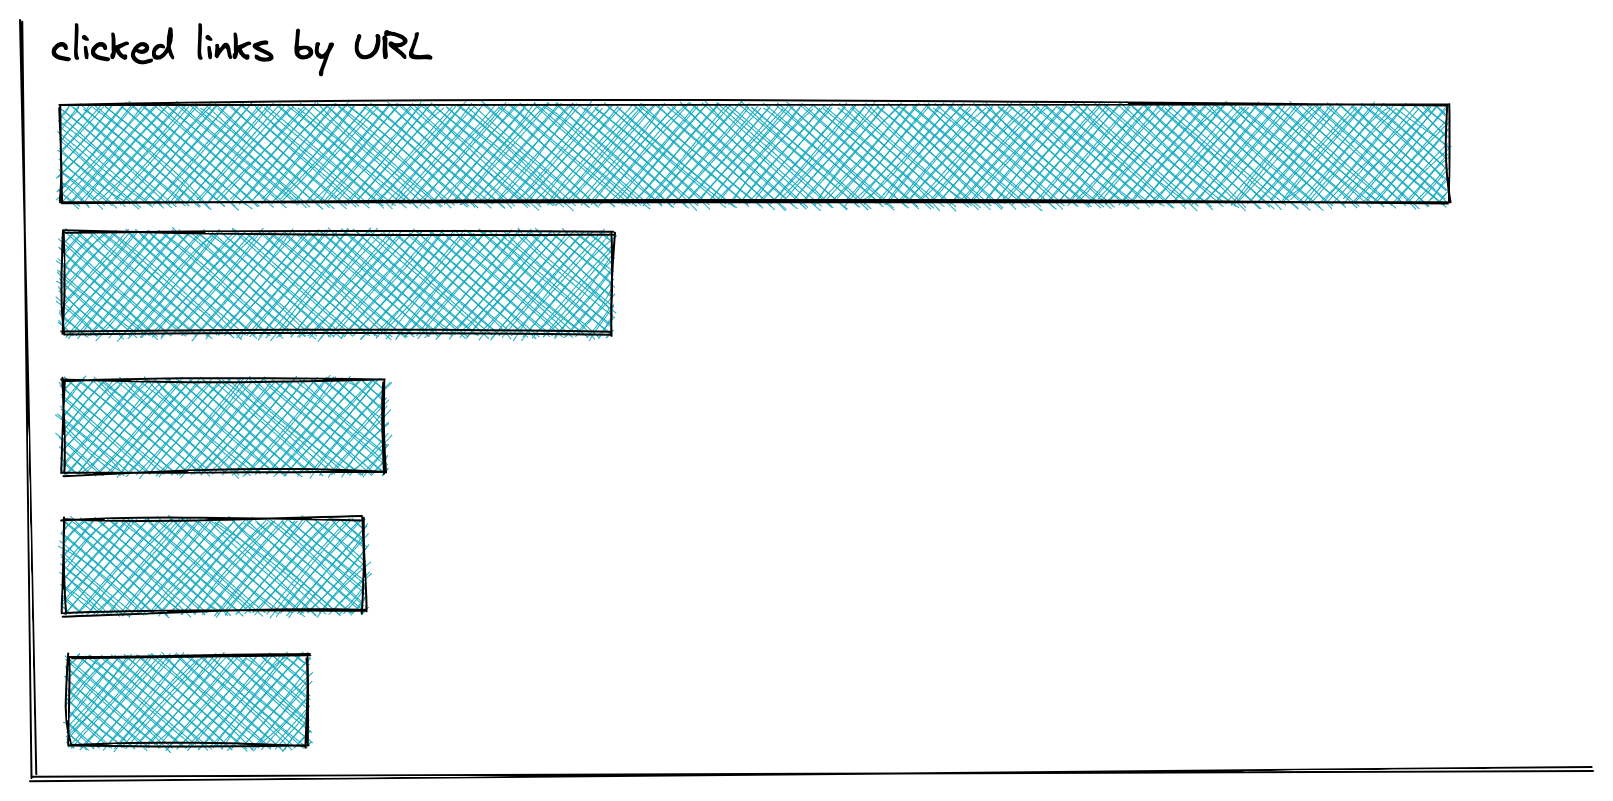
Recognizing patterns in the data that can indicate how people are behaving can also be useful. For example, if you created a supertask topic that contains links to 6 steps in a complicated decision tree process, you could gather the clickthrough data for that topic and see which links are being clicked most frequently, and from which page.
Relatedly, if you have a wayfinding navigation topic, you could gather the clickthrough data for that topic and determine if people are using the links in that topic at all, or not. If not, they might be using search or the table of contents instead of the links in that topic. You need to add context to reliably validate your interpretations.
Maybe you have a page in your documentation that introduces the API for your product, then links to an auto-generated API reference site. You can check your metrics to determine whether, as you might expect, that link gets a lot of clicks.
For most engagement data, you want to contextualize the data. You need to know information about the documentation to make assumptions about whether a low engagement rate on a page is meaningful. If it’s a landing page, maybe you want a low average engagement time, while you might expect a higher average engagement time on a reference page with a lot of function descriptions.
Engagement metrics are ultimately limited in their usefulness. They can’t communicate people’s motivations, so you can’t draw reliable conclusions about why people are clicking links, what’s contributing to a bounce rate, or provide a reason for a high or low engagement time. Engagement isn’t a straightforward proxy for reading.
If you really want to know more about people’s behavior and motivations, supplement these metrics with added context and user interviews.
Contextualize the data #
When you interpret your analytics to try to validate your assumptions about the answers to specific questions, you need a thorough understanding of the data values and the likely causes.
It’s crucial to add context to your documentation site analytics to help identify the causes of unexpected data points, such as outliers.
With context, you can try to understand why your page views spiked on December 15th, or the email channel became a dominant referrer for a week in June.
When it comes to documentation site analytics, I find it most helpful to add the following types of context:
Add behavior context #
Talk to users to add context to user behavior.
Beyond how many people are viewing the documentation, you also want to know why they are viewing the documentation.
Talking to users is the only way to answer questions like “why are people staying on the SDK function reference page so long?” or “how do you typically get to the documentation and why?”.
I always recommend supplementing site analytics with user interviews, as Bob Watson also recommends on his blog post, Tips for conducting documentation research on the cheap.
If you have access to a user experience researcher, work with them to conduct some high quality user research about your documentation. The Write the Docs website has helpful resources about user research.
Ultimately, the best way to know if your documentation is useful and valuable is to ask the people you’re writing it for.
Add product context #
Add product telemetry and information to add context to your website metrics. It’s difficult to evaluate a baseline or understand patterns in your documentation metrics without an understanding of user behavior in the product.
You can do this in a number of ways.
Correlate with product telemetry #
If you can, I recommend correlating site analytics with product telemetry data. Very few folks have an end-to-end data surveillance apparatus to follow users from web application to documentation site with one session cookie.
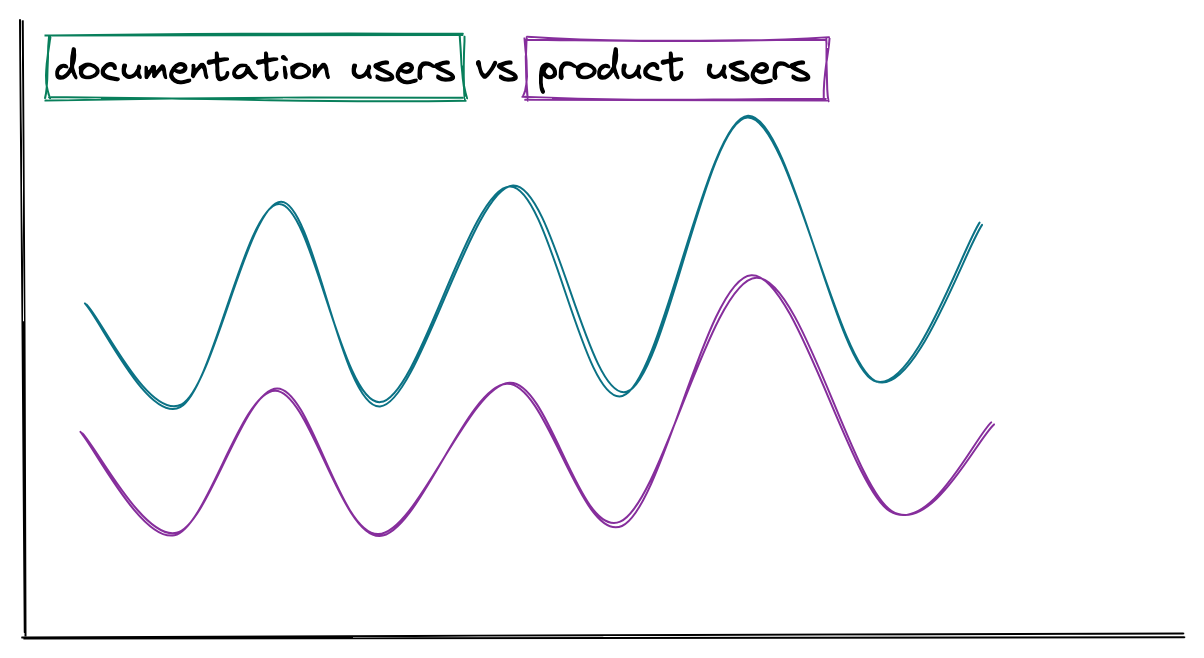
Instead of a complex approach, stick to the basics. Compare rough numbers of site users to rough numbers of product users. It’s only helpful to do this at a large enough scale to where rounding and measurement errors won’t affect any conclusions that you draw.
This context can help you evaluate whether a higher-than-average number of views for a documentation topic about a particular product feature is happening at the same time that the product feature itself is seeing a higher-than-average number of active users.
Beyond active users, you can talk to product managers and other internal stakeholders, to get an understanding of what product-related metrics and information they use. Some of it might be helpful to you.
Consider the product functionality #
In addition to product telemetry, consider what you know about the product itself.
You’re likely to see more page views (and feedback) for topics about popular existing product functionality.
Maybe your product uses in-app documentation for some functionality, such as auto-complete for commands. If you see lower-than-expected page views for those pages, the in-app documentation could explain why.
As another example you might see frequent searches for a specific phrase that isn’t in the documentation, but in reviewing the product itself, discover that the product uses that phrase in the user interface. That’s valuable context to explain why customers are using that search term to look for documentation.
Add documentation context #
Perhaps the easiest context for tech writers to add when reviewing site analytics is context about the documentation itself.
Consider topic type #
You always want to consider the type of content you’re evaluating:
- Is it task content?
- Reference content?
- Concept content?
- Intro content?
- A combination of all of the above?
Topic type matters because users behave differently on different types of content pages. For example, readers might look at a reference topic briefly after locating the information they need, but spend awhile on a concept topic reading and making sense of the information.
If your documentation isn’t strongly typed, you might not notice differences in clickthrough rates or time on page that correlates with topic type.
Consider content goals #
You also want to consider the goals of that content, or the purpose of the page, to inform your expectations about how a user might interact with it.
If you’re writing in-depth content like a tutorial or an interactive scenario, you might expect someone to stay on those pages for a long period of time and click links only to other parts of the tutorial.
| topic path | average engagement time | page_views | link URL | click_events |
|---|---|---|---|---|
| /docs/user-getting-started | 02:01 | 1436 | https://example.com/docs/user-next-steps.html | 1201 |
On the other hand, if you’re writing reference content like a command or function reference, you might expect someone to quickly bounce off the page after finding the name of the command they couldn’t remember. Alternately, the page might have a very long time on page from a developer leaving the SDK reference page open while they write a script.
| topic path | average engagement time | page_views |
|---|---|---|
| /docs/command-ref-init | 00:20 | 554 |
| /docs/command-ref-all-transforms | 00:55 | 1203 |
| /docs/sdk-function-ref | 3:07 | 387 |
For a page that you wrote as a navigation or landing page to introduce functionality, you might want to check to see if that page is a common entry point for the documentation, and whether people are clicking the links on that page to get to subtopics.
| topic path | page_views | link URL | click_events |
|---|---|---|---|
| /docs/get-started | 3409 | https://example.com/download | 1807 |
| /docs/get-started | 3409 | https://example.com/docs/user-getting-started | 1436 |
| /docs/get-started | 3409 | https://example.com/docs/install | 1208 |
| /docs/get-started | 3409 | https://example.com/docs/develop-start | 604 |
Many users find information by searching, but there are still users who browse the navigation of websites to find what they’re looking for10. In that case, if more people are landing on subsections instead of the navigation page, you might conclude that more searchers than browsers are using your website.
Consider content scope #
Beyond content type and goals, you also want to consider the scope of the content on a page.
A page that documents functionality that’s only relevant or visible to a small portion of customers is a page that you would expect to have a lower number of page views, or perhaps low engagement.
The methods that people use to get to a page might vary for alpha, beta, or preview content compared to content about a generally available feature. You might expect to see more direct links for content that documents early-stage features, as sales people share links directly with customers. Content about a generally available feature is likely found most frequently from search.
Consider content age #
New content, or newly updated content might have a different page view profile than other pages. It might not get much attention because it isn’t indexed fully by search engines yet, or it might get a lot of attention depending on the business and industry context of the feature covered by the page.
When you publish a new documentation page or a new content rearchitecture, avoid looking at the metrics immediately after you publish. Leave time for the page views to settle into a consistent pattern before drawing in-depth conclusions from the data.
Older content that hasn’t been updated in some time might not get a lot of page views. It might get a lot because maybe it’s the canonical topic for installing your product, and the installation process hasn’t changed in months. Content age alone isn’t enough of a signal.
Add business and industry context #
You also need to add business and industry context to your analytics to make sense of patterns and outliers that you identify.
Consider what your company is doing, and how that might affect your documentation site analytics:
| Company behavior | Possible analytics pattern |
|---|---|
| Marketing department starts a new campaign with specific terminology | Increase in search terms with the same terminology |
| Company hosts a three-day conference | Higher page views before, during, and after the conference for new feature pages. Lower than average engagement during the conference |
| Leadership interviewed on a popular podcast or television show | Higher page views on the documentation homepage. Novel search terms or higher volume for basic search terms. |
You also want to consider what is happening in the industry around your company or organization:
- If your product was included favorably in an analyst report, such as the Gartner magic quadrant, page views and searches for your documentation might increase.
- If your organization has been featured on a popular website or email newsletter, you might see a new channel or session source on your documentation site.
You can add helpful context to the metrics you’re trying to analyze with a good understanding of the business and industry context for your product and documentation.
Conclusion #
It’s tough to know where to start using website analytics with documentation, especially when the tools and resources primarily address different use cases.
Analytics are intimidating, but remember, they’re fuzzy too. Fuzzy and imperfect proxies for what we really want to know: Is our documentation helping?
Despite being imperfect proxies, it’s useful to look at site analytics to reduce our uncertainty about the answers to specific, discrete, and data-focused questions.
After reading this post, I hope you can more confidently look at site analytics data, evaluate it against your assumptions, and add valuable context about user behavior, product usage, documentation types and goals, as well as business and industry activity.
What next? #
- Watch Kumar Dhanagopal’s presentation at Write the Docs Portland 2022, Don’t trust the numbers!
- Subscribe to Bob Watson’s blog, Docs by Design.
- Watch my talk or read my blog about adding data to your documentation prioritization process.
- Level up your data analysis by exporting your data to a more robust tool where you can do advanced analysis and visualization.
- Dive into the resources on a site like Analytics Demystified to get more familiar with the analytics platform that you’re using.
- Explore other data sources, such as metadata about your documentation like topic length, header length, readability, and more. Kumar Dhanagopal covers this in his talk as well.
-
If you’re using Google Analytics 4, get familiar with what you can do in Reports and Explorations. ↩︎
-
For example, say you’re using Google Analytics 4 and your documentation is all on one domain. You can filter on hostname and focus on only that content. If your content is only relevant for a specific path, well, now you’re struggling to build a filter in GA4 because it looks for exact regex matches by default, whereas UA did partial matches and also supported in-table regex filtering. If you need to match a variety of content such as
/docs/guide/admin-intro.html,/docs/guide/configuration-guidance.html,/docs/guide/config-details.html,/docs/guide/administrator-reference.htmland others, I recommend using Explorations and creating a custom Events Segment with regex matches for the paths. In this case, one condition would bePage path and screen+matches regex+/docs/guide/admin.*ORPage path and screen+matches regex+docs/guide/config.*to match all the page paths starting withadminorconfigand map to the relevant topics. Create as many filter conditions as you need, and maybe wish that past you (or another past writer) was a bit more consistent with topic title naming in the URL path! ↩︎ -
As Kumar Dhanagopal points out in his talk at Write the Docs Portland 2022, Don’t trust the numbers!, Offline and secondhand usage is missing from the data. Anyone who blocks cookies isn’t tracked, and people who download PDFs of the documentation aren’t recorded either. Remember that website analytics data do not provide an exhaustive accounting of people viewing your documentation. ↩︎
-
The Google Analytics 4 documentation on Default channel grouping provides the rules that comprise these definitions, but the descriptions aren’t that helpful. Thankfully, a blog on How to Change Default Channel Settings in Google Analytics has useful descriptions. ↩︎
-
Page referrer is a parameter and not a top level dimension that you can add to reports in Google Analytics 4. As a result, you’ll want to set it up as a custom dimension so that you can add it to tables. See the Google Analytics 4 documentation on Custom dimensions and metrics. ↩︎
-
Google encrypts user searches, and as a result, doesn’t share individual search terms that might lead users to your site with any analytics tools including its own. ↩︎
-
This blog post on Search Engine Land about How to get the most out of the Google Search Console API using regex provides useful guidance for making sense of Google Search Console. ↩︎
-
For a definition of total users and active users, see the Google Analytics 4 documentation on Analytics dimensions and metrics ↩︎
-
Google Analytics 4 includes a
scrollevent with apercent_scrolledparameter, but knowing how far someone scrolled on your page doesn’t tell you if they were reading your documentation. Because documentation is usually scanned or referred to rather than read, identifying the scroll percentage for a documentation topic is not helpful. ↩︎ -
Tucker FitzGerald addresses these two types of patterns in depth in an article for UX Booth, Searchers and Browsers: the Personality Types of UX. The excellent entry on How people find information in the Australian Government Style Guide pointed me toward his article. ↩︎