2021 in Music: Spotify Wrapped, Last.fm, and Ethical Music Consumption
It’s been another unexpected year. Thinking about how I had a January and February stacked up the same way I spent all of my 2019, and booked up an April 2020 to be more of the same, and then whomp, pandemic, and all of my priorities changed.
I’m back with my yearly music data rundown, featuring a comparison with my Spotify Wrapped data (as always), a deep dive into my artist obsession of the year, some added stats about when I listen to music this year (and whether it’s different from past years), and more.
Want to skip around this post? Here’s what I cover:
- What’s a musical aura?
- Spotify Wrapped: Unpacked
- The scale of my Fred again.. obsession
- The tops of Spotify top 100
- My top albums of 2021
- BPM and its flaws
- Highlights of discovered artists
- My year in concerts
- When am I listening to music?
- How much money?
- Added commentary
What’s a musical aura? #
Spotify Wrapped this year included an “audio aura” with my top “music moods”:
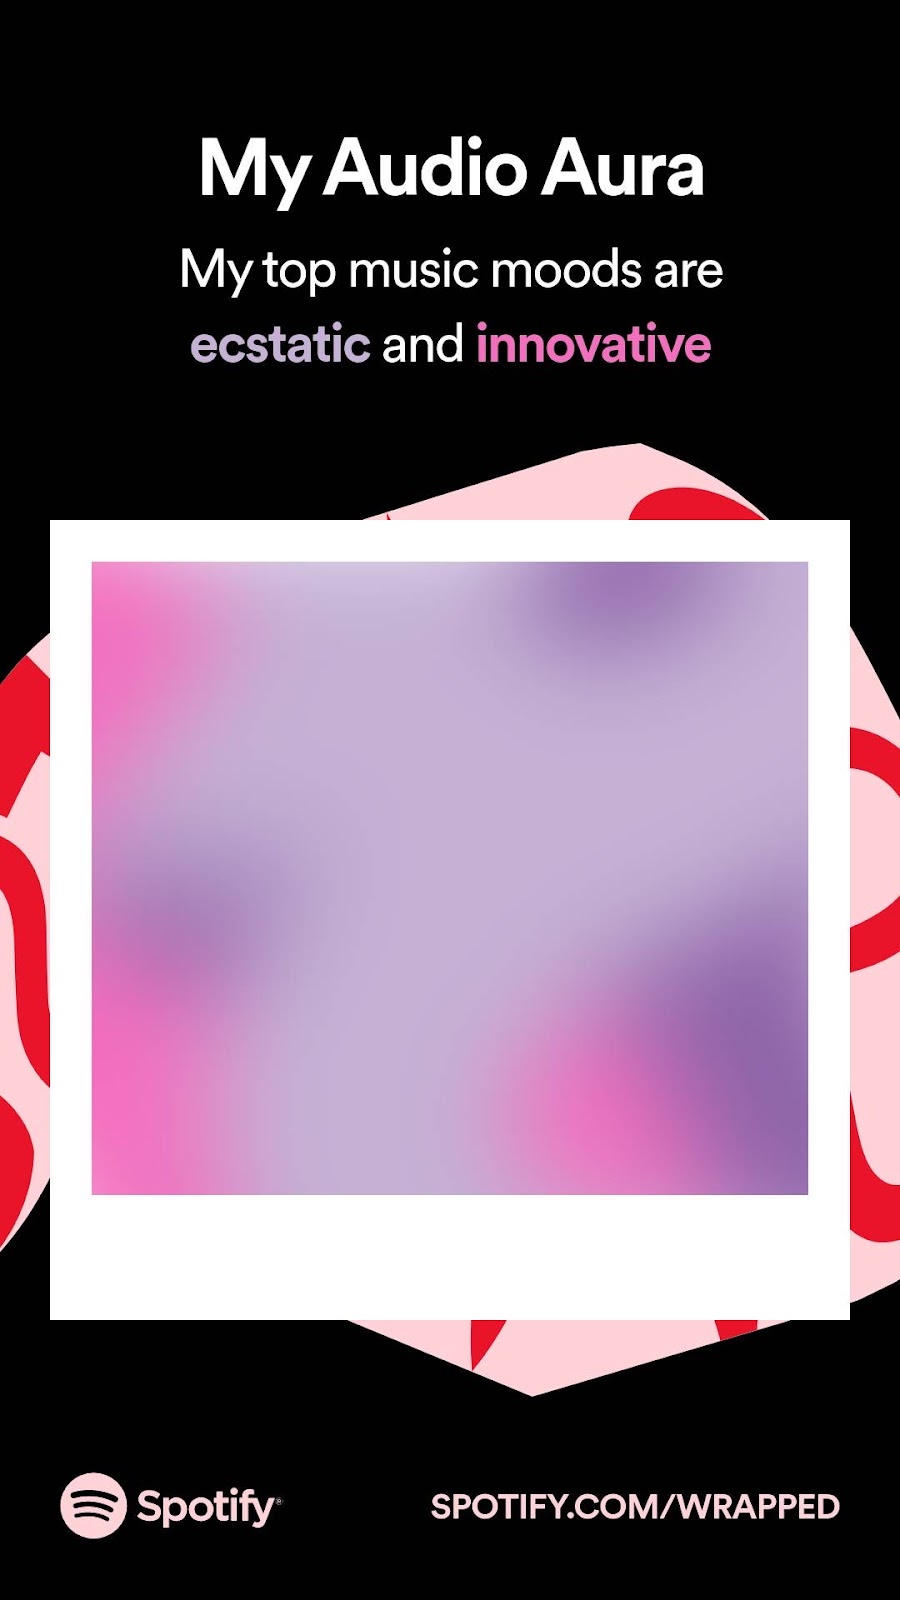
Digging into this feature, it seems that Spotify consulted an “aura reader” to assign colors to “six mood descriptor categories” and matched them with Spotify tracks.
After we created your personalized 2021 Wrapped experience, we assigned a weight percentage to the two audio “moods” that best represent your listening, and the final product is a swirling gradient of color. Below are the six moods and corresponding hues that could come up in your 2021 Wrapped Audio Aura.
My best guess is that there must be an internal API that contains mood descriptors for Spotify tracks that helps them build their emotion-based playlists. The closest metadata available in public APIs is the “energy” audio feature, which isn’t enough on its own to associate with an emotion (at least in my opinion).
I don’t yet have comprehensive Spotify audio feature data for my listening history, but I can’t begin to guess which music I listened to was categorized as “ecstatic” or “innovative”.
It’s purple and pink though, so that means:
Purple: This aura color pairs well with passionate music listeners. Purple auras tune in to get amped up, entertained, and moving while they navigate the twists and turns of their day.
Pink: Often described as the hopeless romantics of the aura spectrum, pinks view the world with a sense of optimistic, childlike wonder.
I wouldn’t describe my year, or even my music listening, as being largely driven by trying to stay amped up, entertained, occupied, optimistic, or wondrous about life. I felt fairly emotional and moody, tbh (those might be the same). If I take the time to dig into this further, I can check and see what the audio features are for my top Last.fm track:
and my top Spotify track:
Using the Spotify developer console to call the track audio features API yields the following metadata for Kyle (I Found You):
    {

      "danceability": 0.76,

      "energy": 0.669,

      "key": 5,

      "loudness": -9.105,

      "mode": 0,

      "speechiness": 0.285,

      "acousticness": 0.0757,

      "instrumentalness": 0.0215,

      "liveness": 0.77,

      "valence": 0.215,

      "tempo": 112.023,

      "type": "audio\_features",

      "id": "6Ao5d7TMQ92h87jQqSHGyw",

      "uri": "spotify:track:6Ao5d7TMQ92h87jQqSHGyw",

      "track\_href": "https://api.spotify.com/v1/tracks/6Ao5d7TMQ92h87jQqSHGyw",

      "analysis\_url": "https://api.spotify.com/v1/audio-analysis/6Ao5d7TMQ92h87jQqSHGyw",

      "duration\_ms": 196071,

      "time\_signature": 4

    }
And for Out Here With Us:
{

  "danceability": 0.695,

  "energy": 0.759,

  "key": 5,

  "loudness": -6.719,

  "mode": 0,

  "speechiness": 0.0346,

  "acousticness": 0.00856,

  "instrumentalness": 0.752,

  "liveness": 0.092,

  "valence": 0.589,

  "tempo": 109.983,

  "type": "audio\_features",

  "id": "6ezfPcUAN8UH6FaQbFfLSp",

  "uri": "spotify:track:6ezfPcUAN8UH6FaQbFfLSp",

  "track\_href": "https://api.spotify.com/v1/tracks/6ezfPcUAN8UH6FaQbFfLSp",

  "analysis\_url": "https://api.spotify.com/v1/audio-analysis/6ezfPcUAN8UH6FaQbFfLSp",

  "duration\_ms": 247955,

  "time\_signature": 4

}
Who knows how to really interpret these values, but here they are represented in a column chart, to prove to you that graphical representations of data are not sufficient communication.

It’s possible that the energy and/or valence of these tracks helped contribute to the music mood, but it’s honestly tough to say.
Spotify Wrapped: Unpacked #
Spotify’s numbers of how many minutes I spent listening are pretty close to my less-accurately-calculated numbers, although as I pointed out last year, both numbers are fairly flawed.
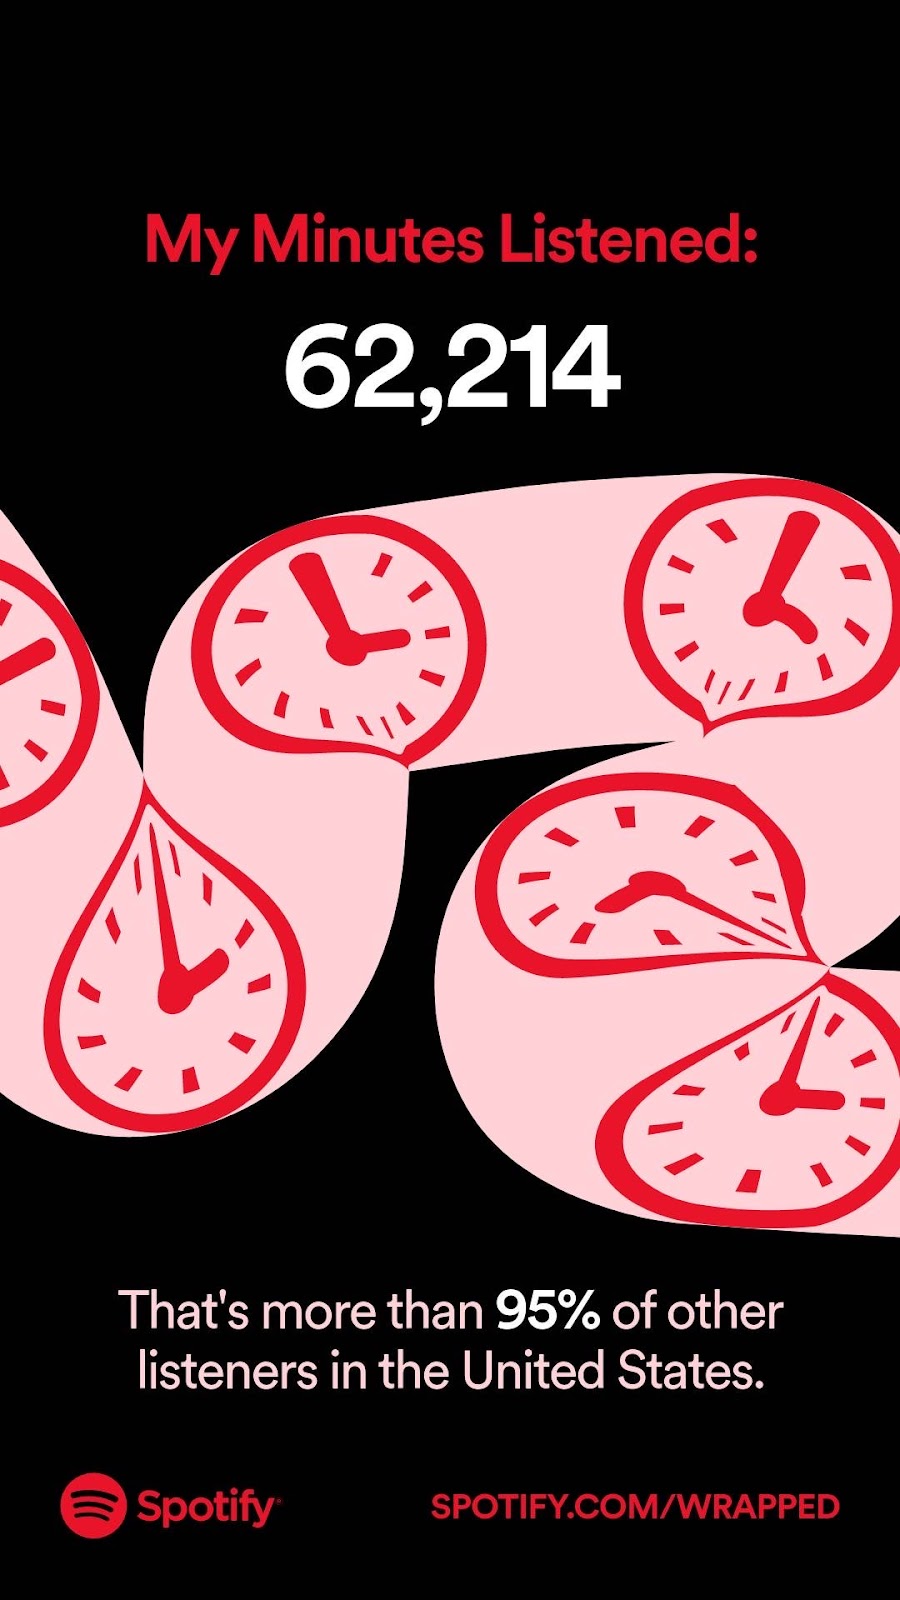
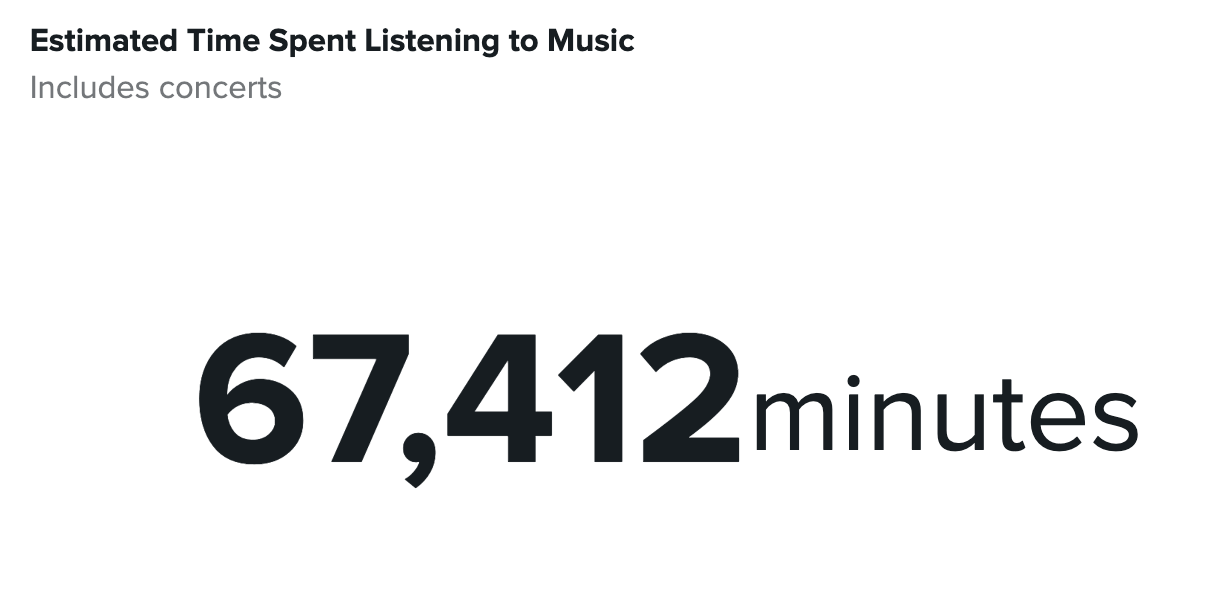
(This has changed throughout the course of writing this post, because I listen to music while I write. If you see inconsistent data across screenshots, this is why. )
Because Last.fm doesn’t include track_length in their API, the best I can do is guesstimate according to the average length of a track in my iTunes library (though I was recently advised that it would make more sense to weight that average by tracks I actually listened to in 2021, which is correct and also more difficult math so I have not done this). I also factor in concerts and DJ sets.
My Last.fm totals are about 5,000 more minutes than Spotify estimates, although I have at least another month worth of data and 7 concerts to factor in. Neither of the numbers factor in any of the DJ sets I listened to offline in SoundCloud on my phone while I was flying around the country for Thanksgiving.
Lots of limitations to quantifying your life, it turns out! And I’m okay with that.
So that’s minutes listened, what else did Spotify tell me?
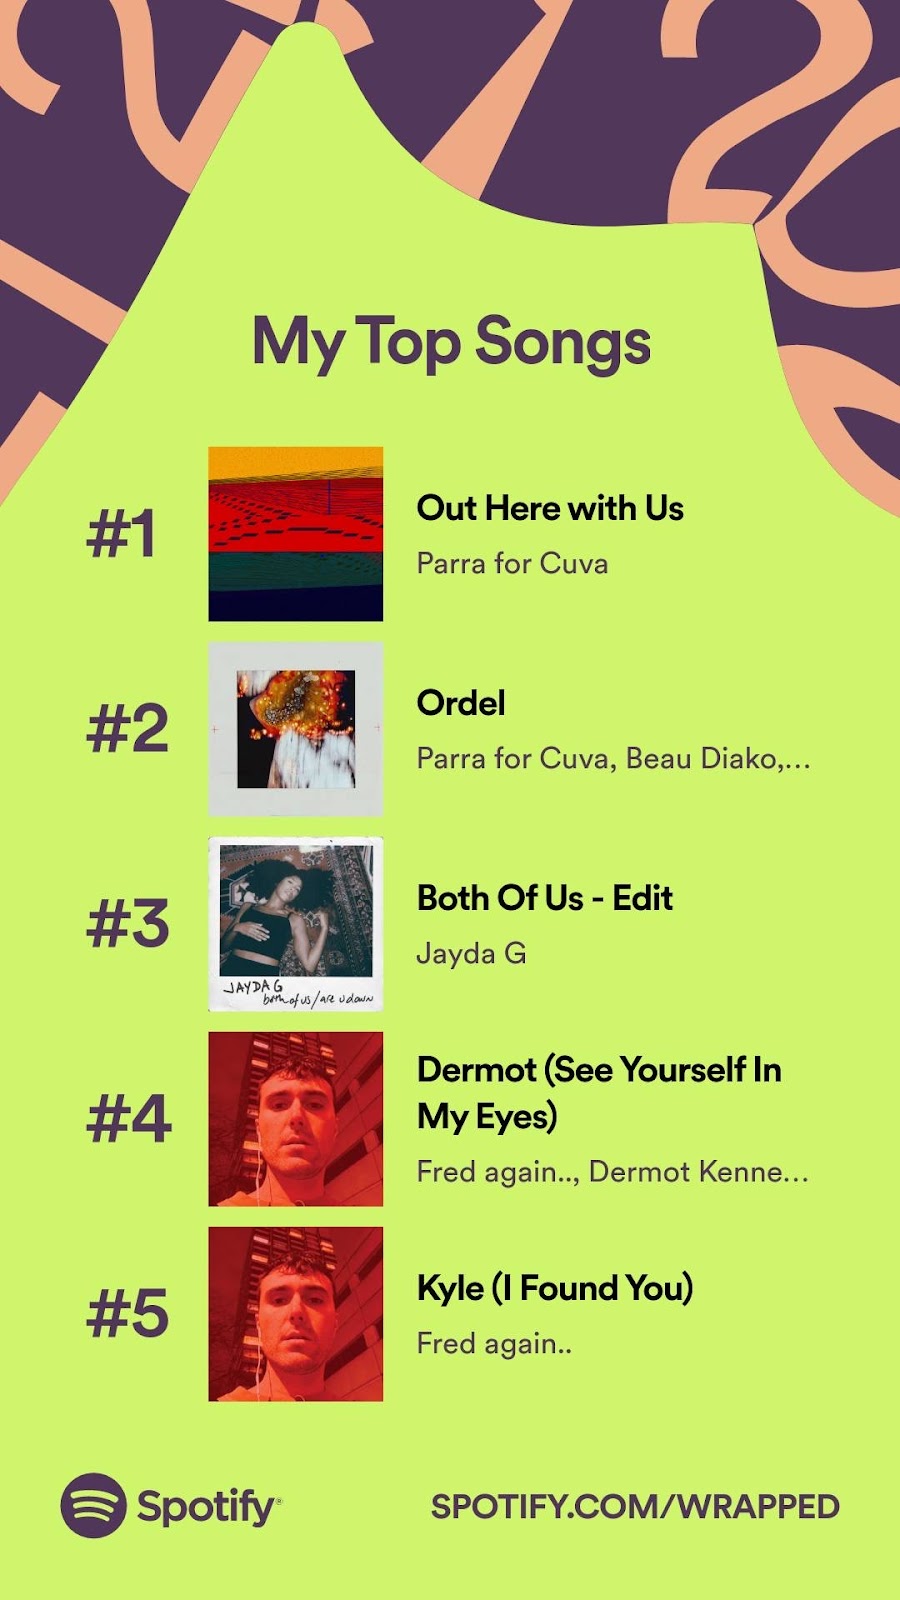
According to Spotify, my top songs are as follows:
- Parra for Cuva - Out Here with Us
- Parra for Cuva - Ordel
- Jayda G - Both of Us (Edit)
- Fred again.. - Dermot (See Yourself in My Eyes)
- Fred again.. - Kyle (I Found You)
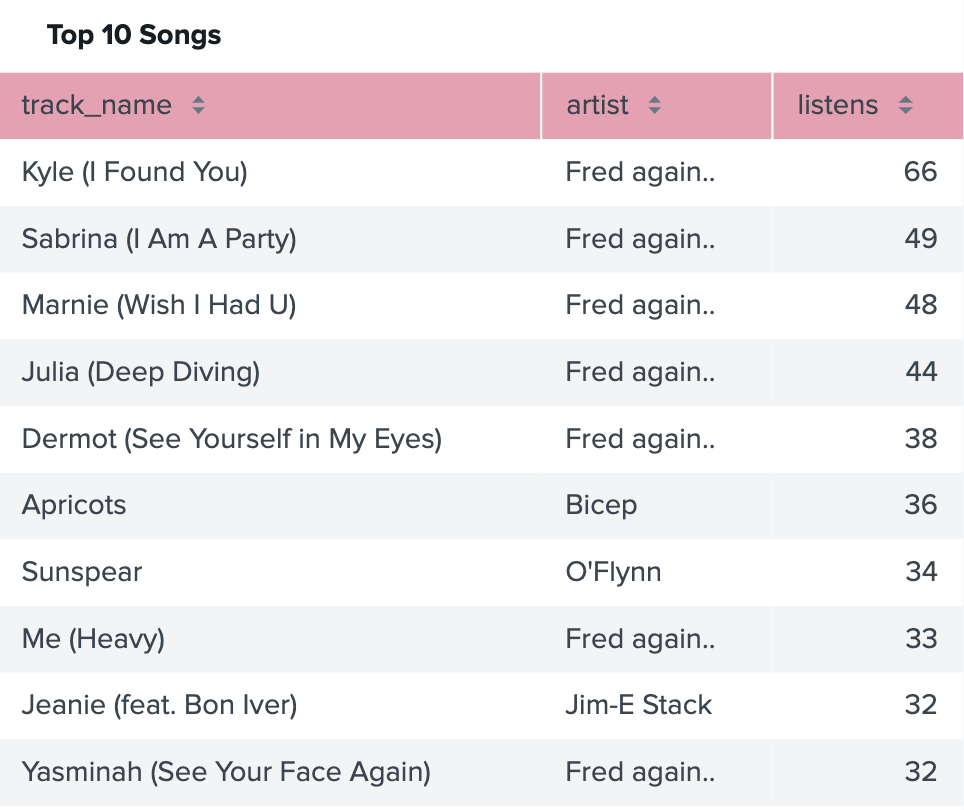
According to my Last.fm data to date, my “actual” top 5 songs are:
- Fred again.. - Kyle (I Found You)
- Fred again.. - Sabrina (I Am A Party)
- Fred again.. - Marnie (Wish I Had U)
- Fred again.. - Julia (Deep Diving)
- Fred again.. - Dermot (See Yourself in My Eyes)
You might be sensing a theme here.
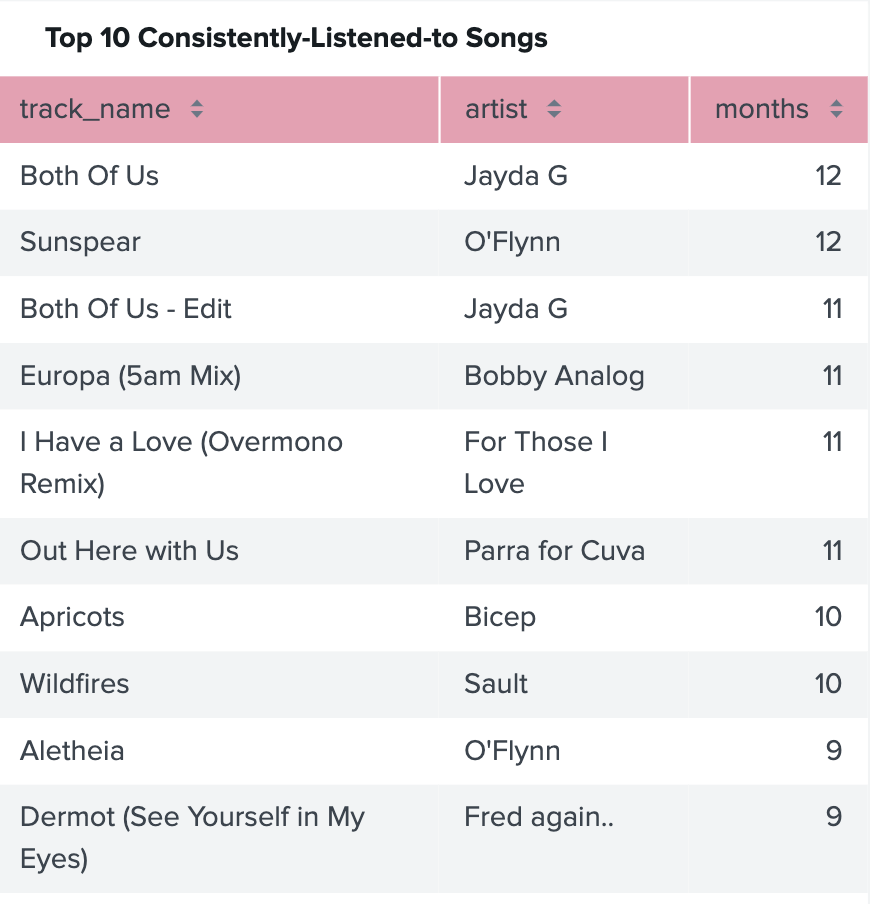
It’s worth pointing out that my Spotify top 5 are a bit better represented if you also consider the songs that I consistently listened to this year—namely, the tracks I listened to at least once a month this year. Considering that list, both Jayda G - Both of Us versions and Parra for Cuva’s track Out Here with Us are clear and consistent favorites of 2021.
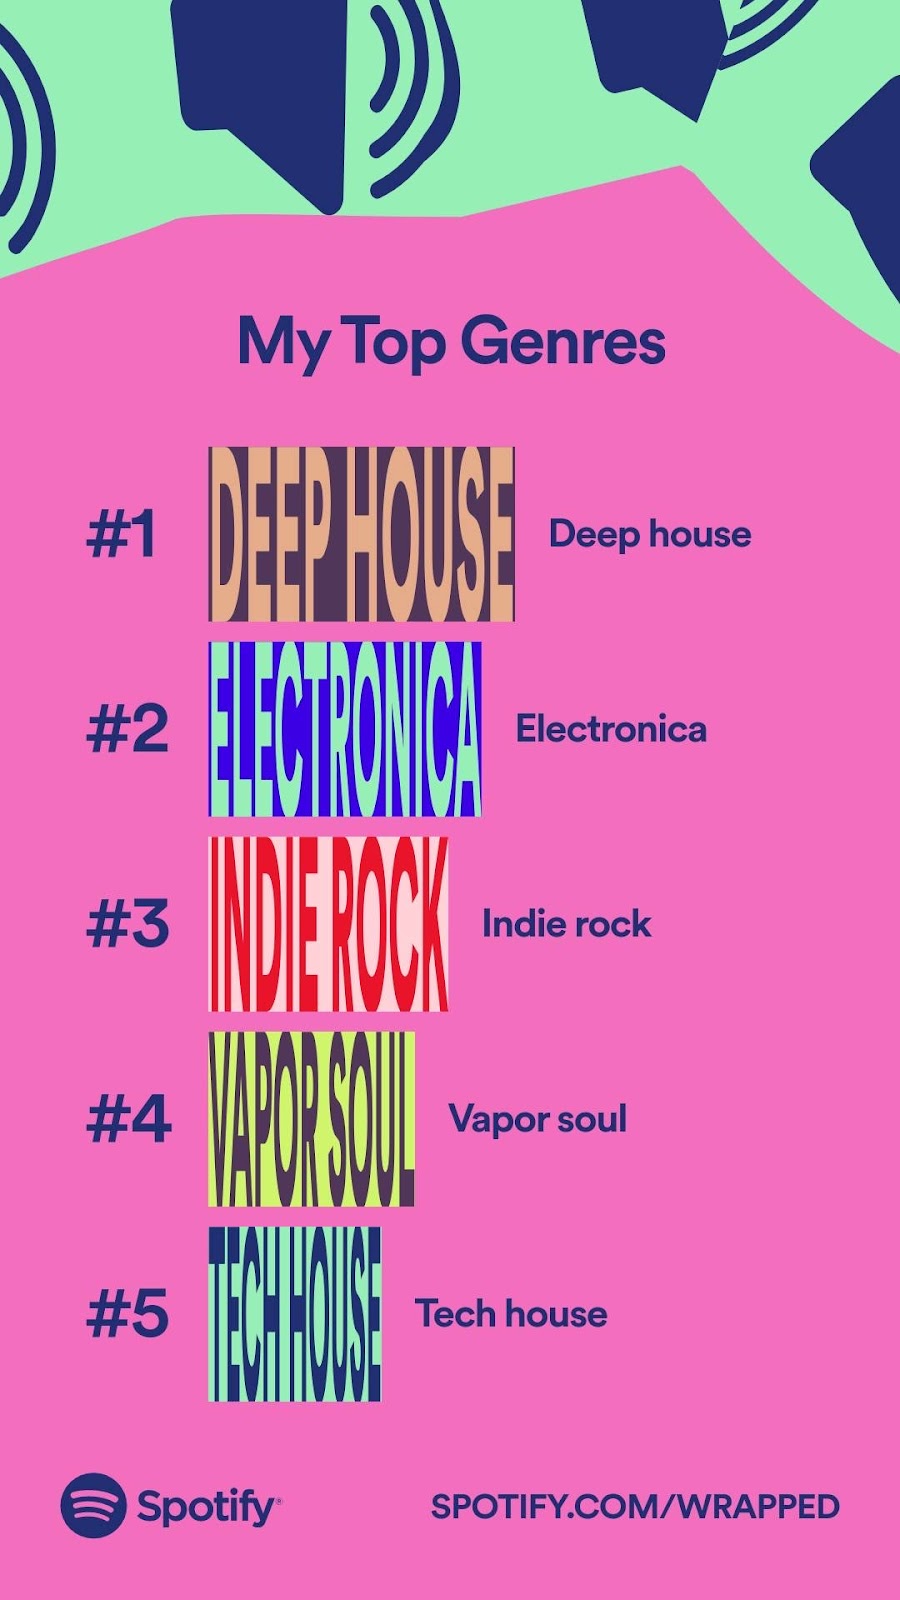
Spotify also used some horrific graphic design to highlight my top genres of the year:
- Deep house
- Electronica
- Indie rock
- Vapor soul
- Tech house
I included a bit of a discussion on genre in my post last year about Spotify Wrapped, and it seems that I’ve been meaning to dive into the meaninglessness of genre for awhile now. Suffice it to say, I don’t know what vapor soul is. I am still coming to terms with the fact that “tech house” is what I used to call “partyboi house”.
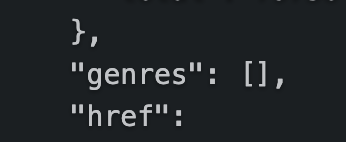
Fred again.. curiously has no genres listed on Spotify per the Developer Console:
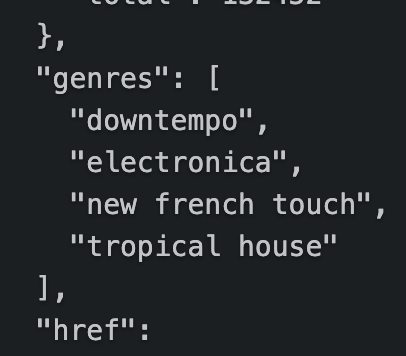
But Parra for Cuva has several listed:
The other sources I have for genre, which is another word for “music category”, are Last.fm tags and iTunes genre for tracks that I’ve purchased this year. Last.fm offers up a fancy diagram of genres that I listened to since about June 2021:
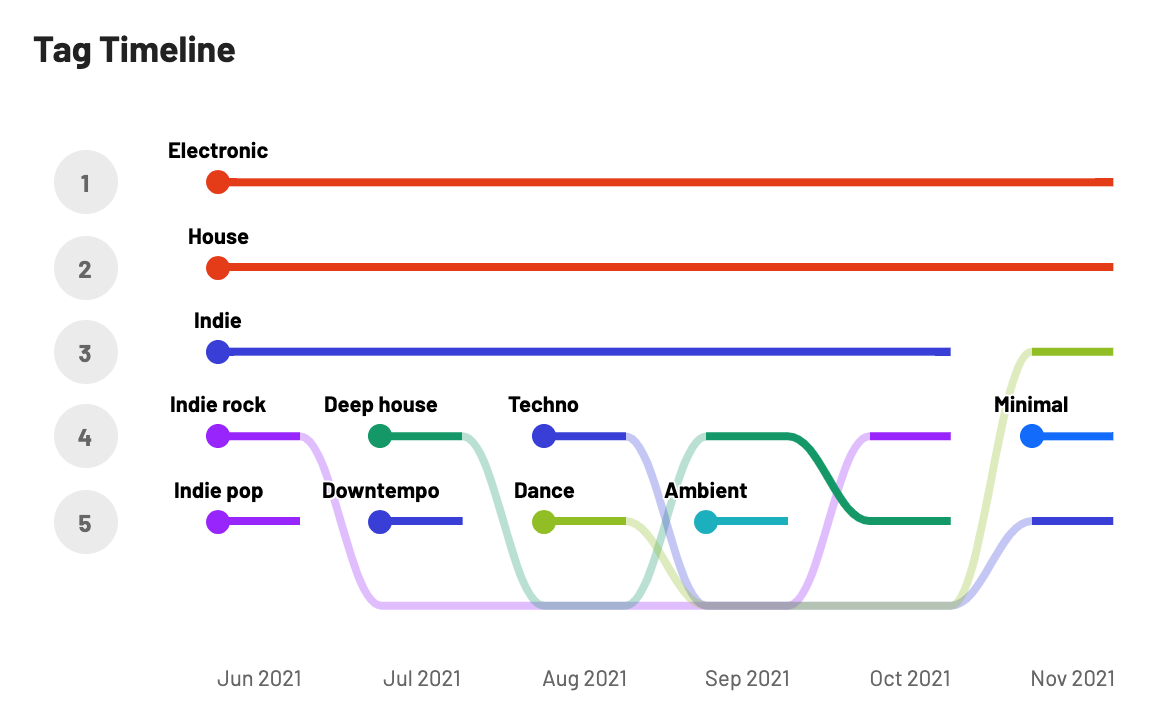
I’m not totally sure what I was listening to in August 2021 that counted as Techno, but I’m glad it was short lived. It seems like Last.fm tags are either more generic, or have more overlap than other services, which is perhaps why Electronic, House, and Indie are so dominant compared to more descriptive genres. A very quick non-representative sample confirms this for me. Fred again.. is tagged as electronic, dance, hip hop, british, house, and personal favourites, making it easy to understand how electronic and house can both dominate the top of this chart.
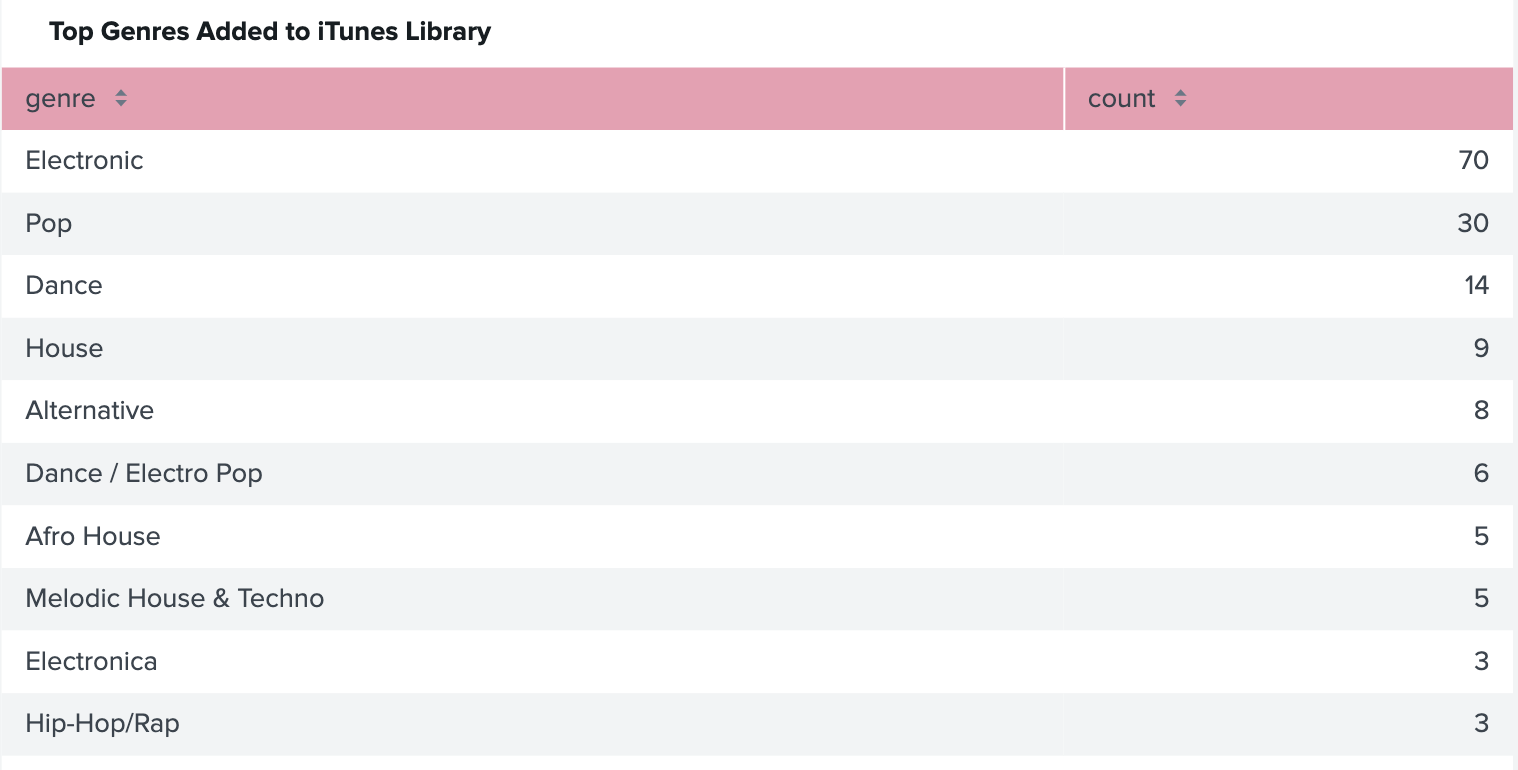
Of course, iTunes assures me that these trends follow me across services. Top genres of tracks that I added to my iTunes library are:
- Electronic (70 tracks)
- Pop (30 tracks, thanks Lil Nas X)
- Dance (14 tracks)
- House (9 tracks)
- Alternative (8 tracks)
iTunes tracks can only have 1 genre, rather than the many that tracks can have in Last.fm and Spotify, so this is going to, by nature, be a simpler list.
In addition to top songs and top genres, Spotify also looked at my top artists. I apparently listened to 3699 artists this year:
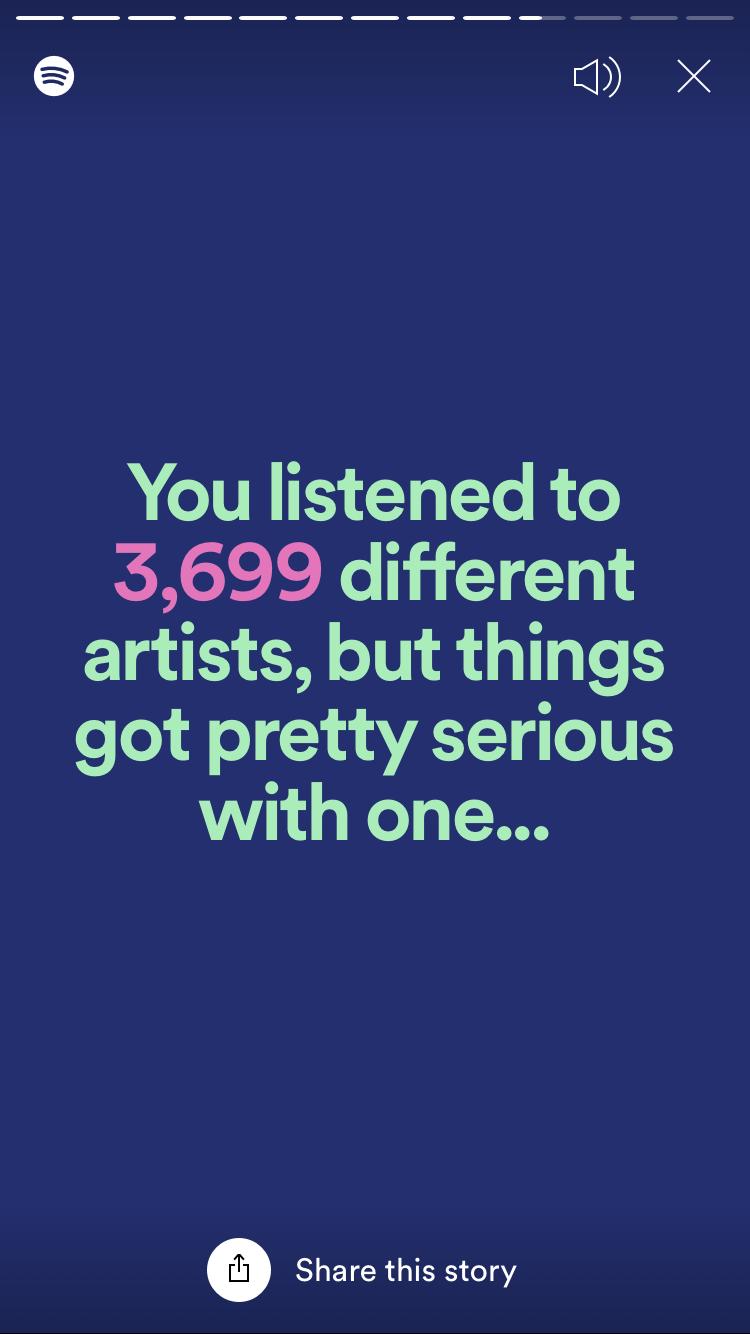
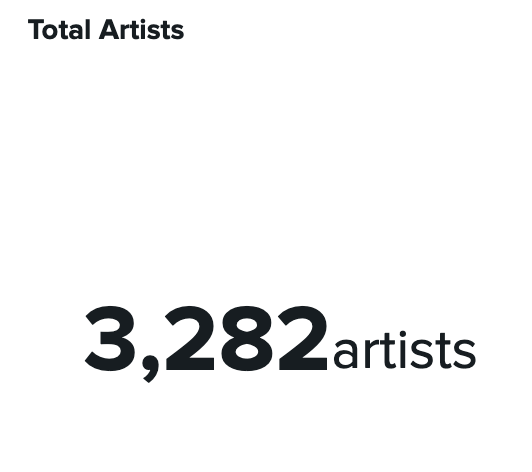
This number is far higher than the number I have in Last.fm data, 3282 artists! Why is that? Spotify stores every artist that appears on a track as a comma-separated list of artists and is able to count each one of them separately. Last.fm does not. That is why. Because of data storage decisions.
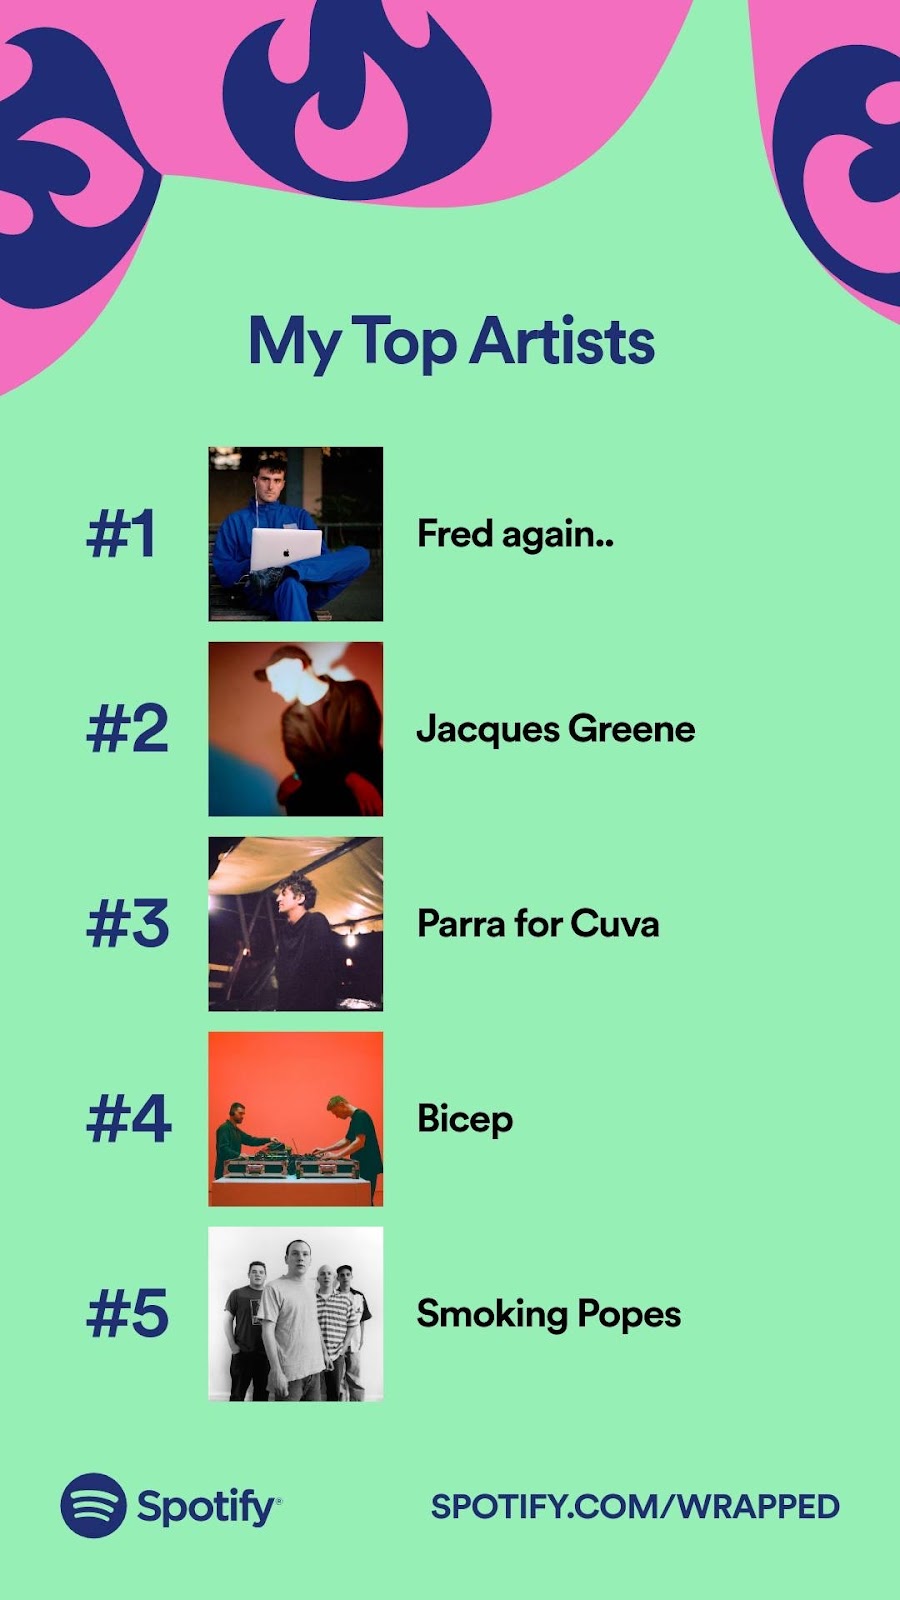
In addition to the total number of artists I listened to, Spotify also tells me what my top 5 artists were of this year.
According to Spotify, my top 5 artists are:
- Fred again..
- Jacques Greene
- Parra for Cuva
- Bicep
- Smoking Popes
Most of these are artists that I binge-listened to for multiple days, but besides Fred, I’m not sure how many of them really stood up year-round and cross-service.
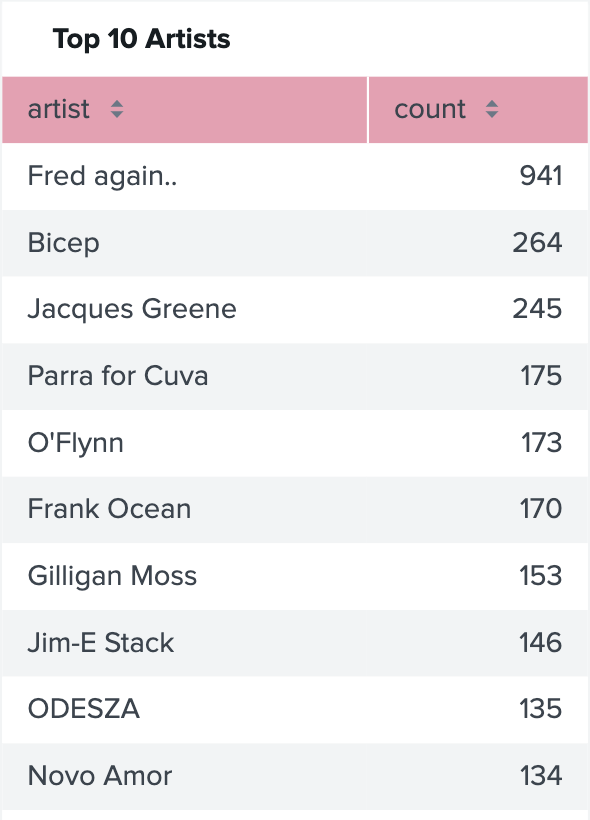
If I look at my Last.fm data again, which of course covers more than just Spotify, I have the following top 5 artists:
- Fred again..
- Bicep
- Jacques Greene
- Parra for Cuva
- O’Flynn
So I guess changing up the order and swapping out O’Flynn for Smoking Popes, that list is pretty accurate.
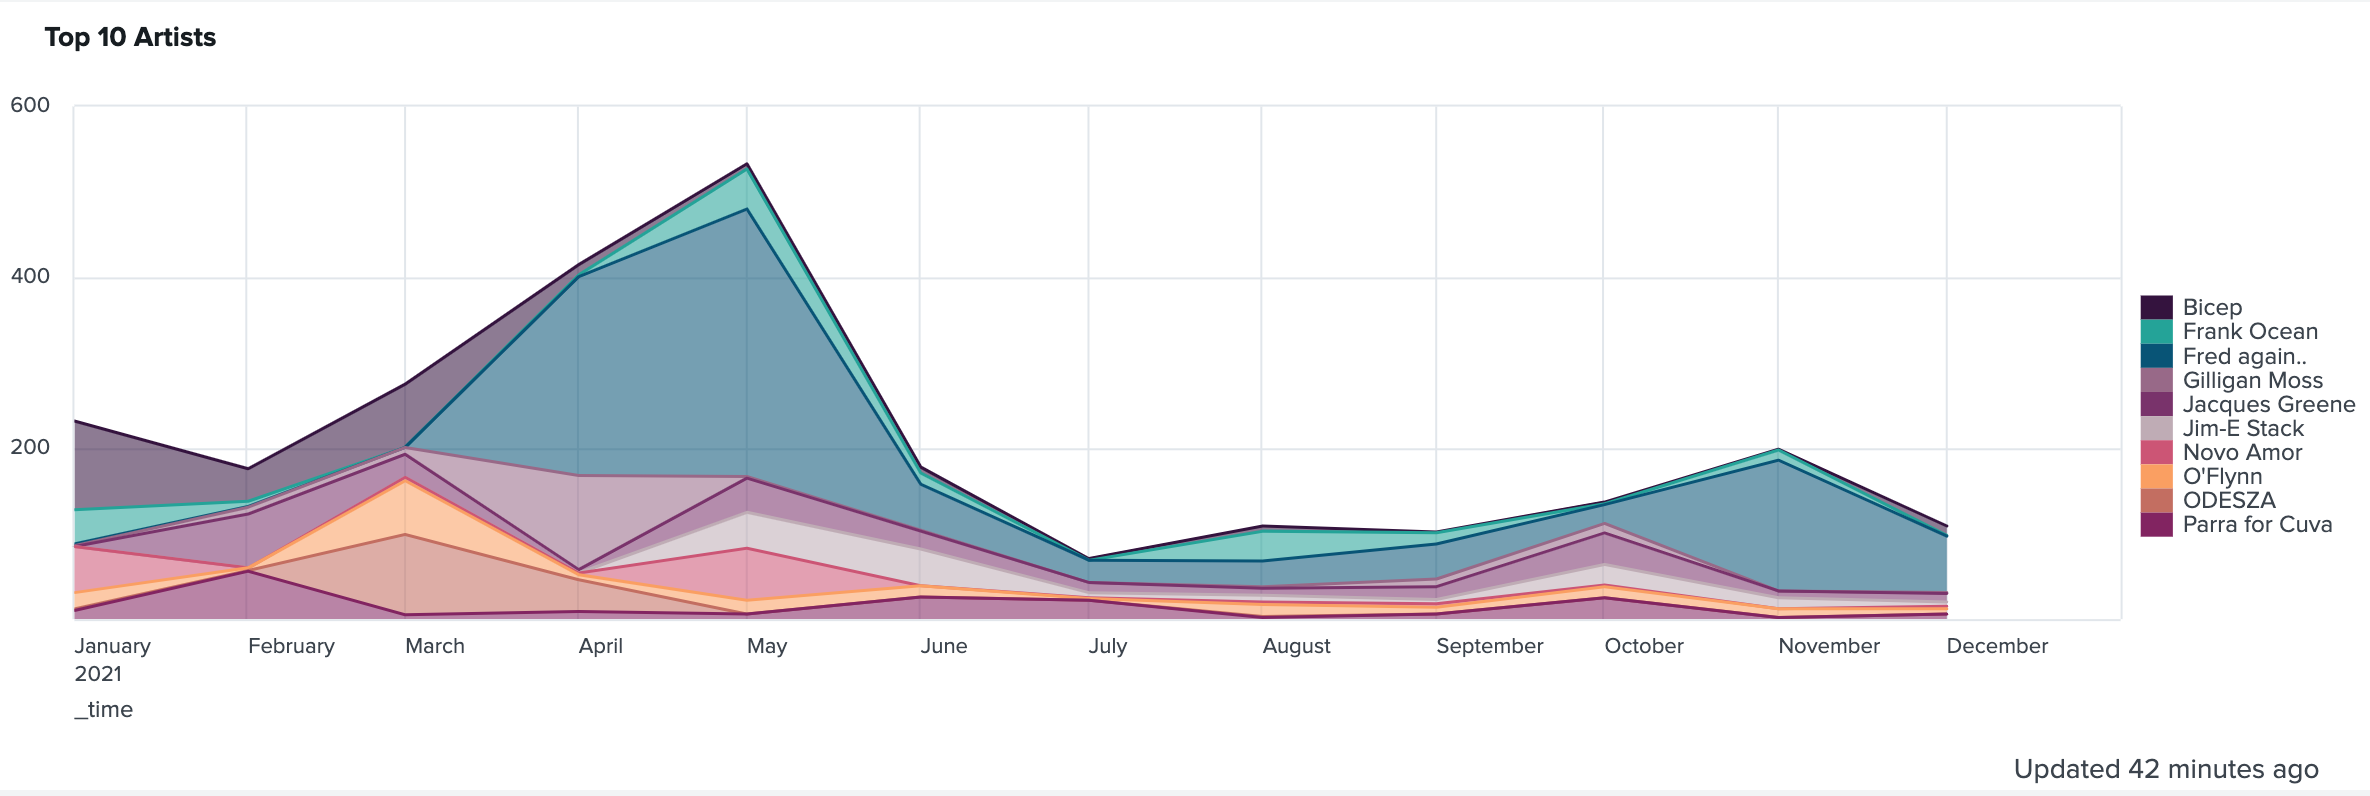
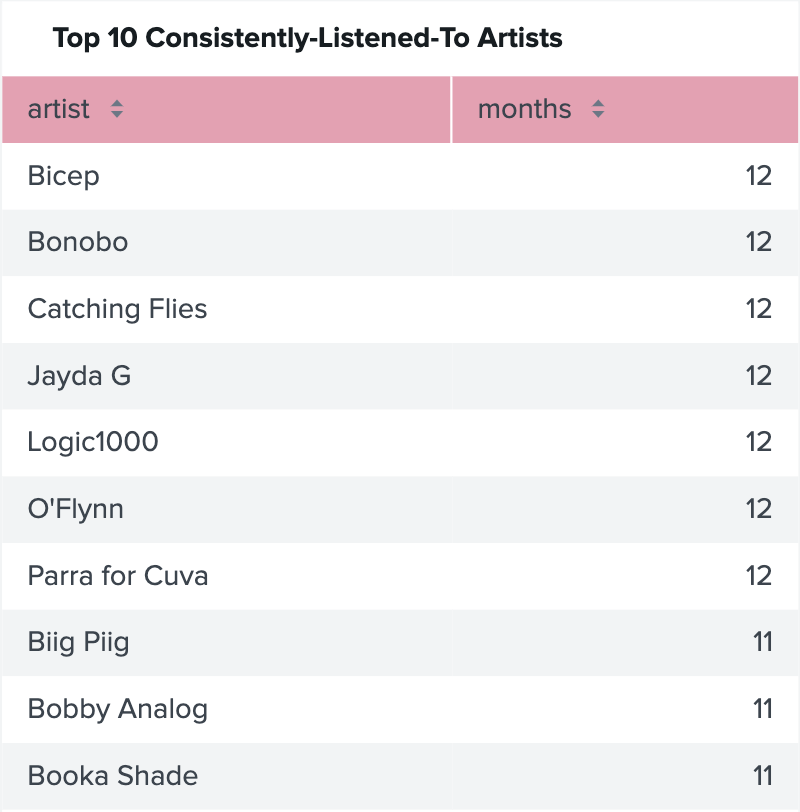
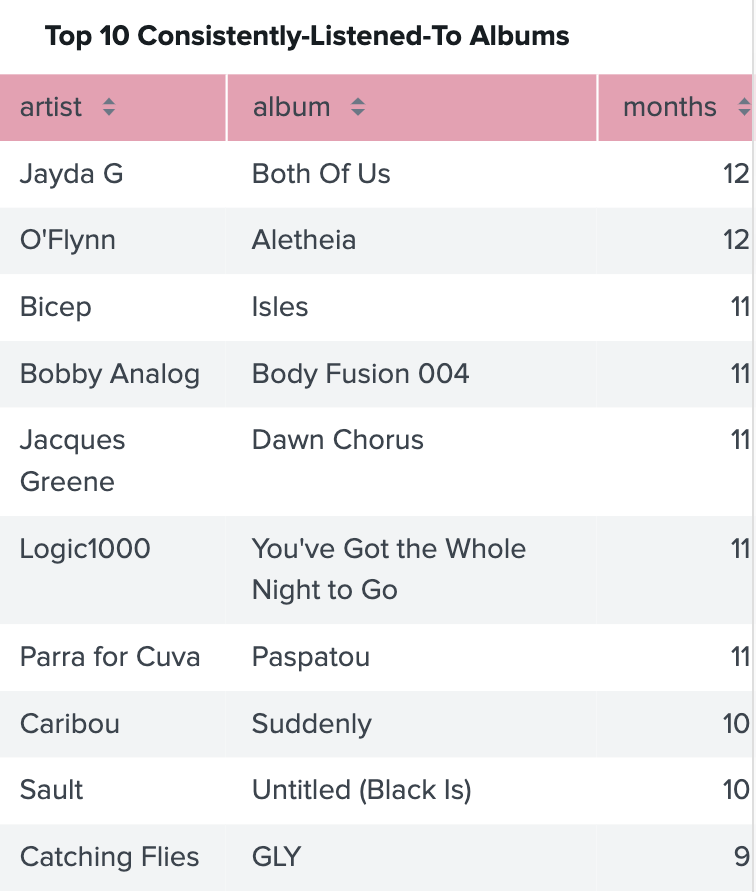
Looking at my top 10 consistently-listened to artists, the story is a bit more interesting. You see that Bicep, Bonobo, Catching Flies, Jayda G, Logic1000, O’Flynn, and Parra for Cuva had the most staying power. The interesting thing about these artists though is that I only listen to a few tracks by each of those artists consistently.
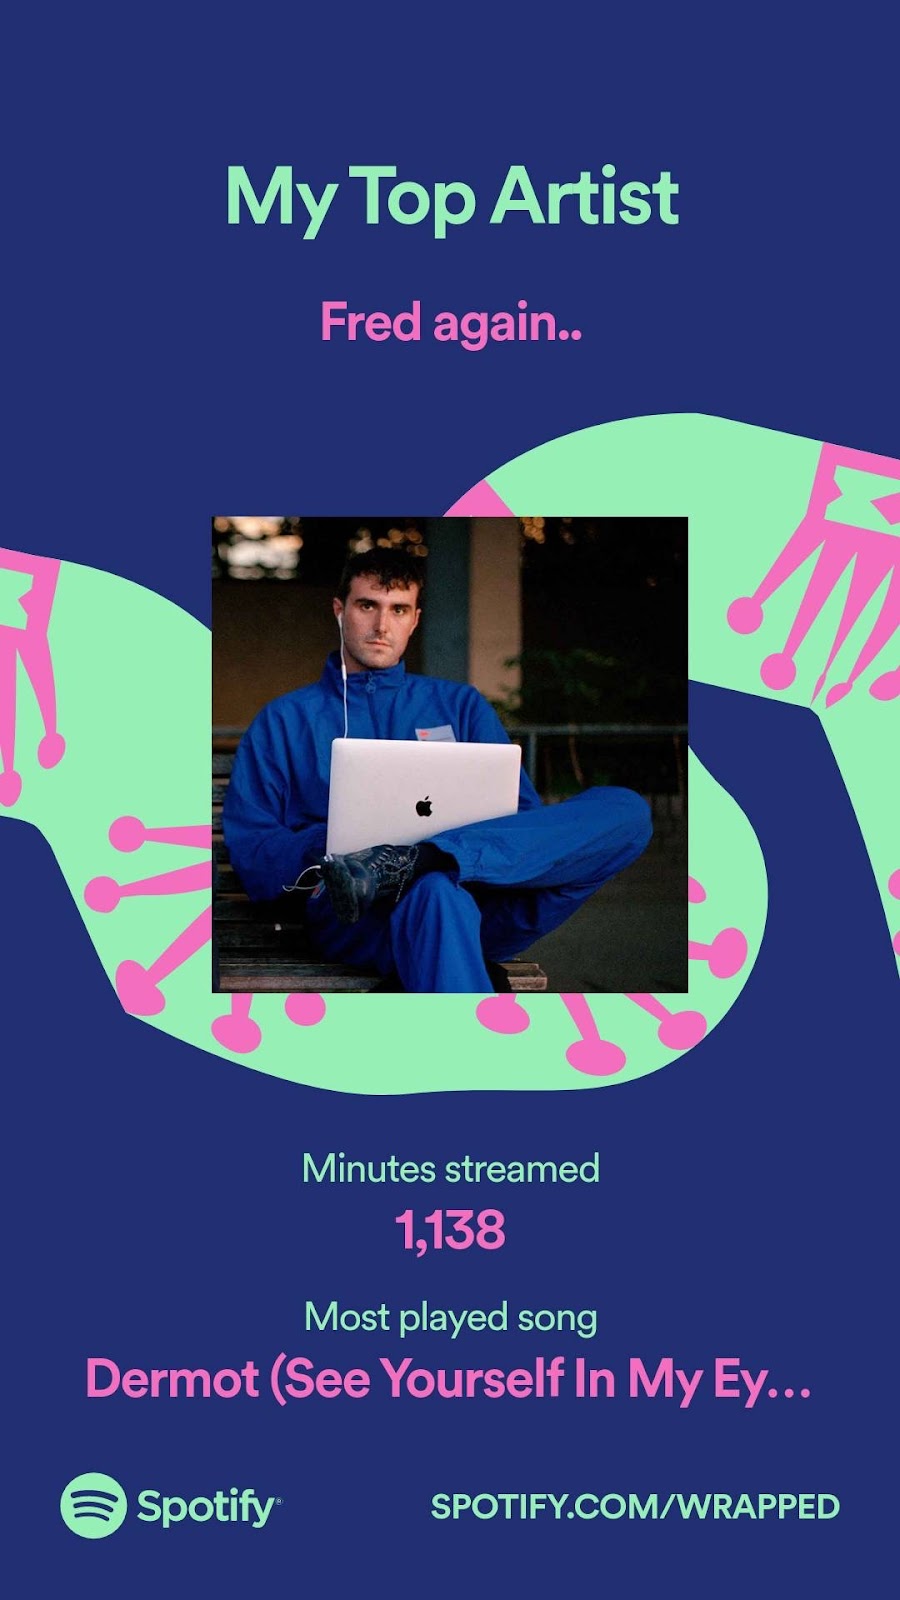
And finally, Spotify took care to identify that my top artist of the year was Fred again.. Indeed, this was the theme across all the services. According to Spotify, I listened to Fred again.. for a total of 1,138 minutes. Let’s dig into what the “real” numbers are across platforms…
The scale of my Fred again.. obsession #
I discovered Fred again.. last year, apparently, but it wasn’t until his album dropped in April that I fell into a full-scale obsession. Spotify says I spent 1,138 minutes listening to Fred again.. out of a total of 62,214 minutes. That’s 1.83% of the total time I spent listening to music on Spotify.
If I look across all platforms (that are tracked by Last.fm), and I look at a track-by-track basis, it turns out that of all the tracks I listened to so far this year, 5.71% (5.70% at the time of this writing) of the tracks were by Fred again..
To put that in perspective, here’s a table of my past top artists with their respective percentage shares of my total listens for that year:
| Year | Artist | Percentage | Total Listens |
|---|---|---|---|
| 2017 | The xx | 1.86% | 8,901 |
| 2018 | Poolside | 1.50% | 10,836 |
| 2019 | Tourist | 2.49% | 10,394 |
| 2020 | Tourist | 1.37% | 16,579 |
| 2021 | Fred Again.. | 5.71% | 16,504* |
* year incomplete
Of course, that’s looking at the number of listens as a share of total tracks. Back in 2019 I declared that based on listening time alone, I’d listened to Tourist for nearly 6% of the total time spent listening. Perhaps Fred has some rivalry after all.
I also want to point out that for some tracks on Soundcloud, I was listening to DJ sets by him that were not properly accounted for in metadata, which is clear when you see the tracks on my Soundcloud 2021 playback
I have another chart where I examine the distribution of track listens for my top artists—what is the average number of listens per track for each artist?

For Fred again.., that number is 13 listens per track. The next closest artist is Jim-E Stack with 9 listens per track, but again, let’s look at scale. 13 listens per track for 72 tracks by Fred again.. (singles are listed separately from album tracks), and 9 listens per track for 16 tracks by Jim E-Stack. It’s the difference between obsessing over a single EP and some back catalog of an artist, and obsessing over the entire available catalog of an artist.
This is a lot of data, and the numbers are clear that I love Fred again..’s music. I wasn’t lucky enough to snag tickets for his LA or NYC shows, but I will 100% see him the next time he makes it stateside. If you want to check him out, head over to Soundcloud and listen to my favorite song of his, Eazi (DoItNow):
The tops of Spotify top 100 #
Along with Spotify Wrapped, Spotify puts together a playlist of 100 tracks that were most listened to and relevant I guess, to my year. If you want to listen along, you can find my playlist here. (It’s fun to note that the playlist itself isn’t actually shareable directly, I guess because breaking customer expectations of how links work is a “great” way to do marketing.)
Given that not all the songs I listened to and enjoyed were on Spotify this year, my Spotify top 100 playlist is going to be missing some notable favorites beyond Eazi (DoItNow), such as Jacques Greene’s stunning edit of Frank Ocean’s track White Ferrari.
That aside, it turns out that the tracks on the playlist aren’t a 1:1 listing of your top 100 most played tracks. I find this to be fascinating, and makes it clear how much thought Spotify puts into making listenable playlists vs ones that are direct reflections of ~ the data ~. As the Spotify Wrapped FAQ puts it:
Yes, for the most part your playlist is ordered by the songs you played most frequently to least frequently.
“For the most part” is doing a good bit of work there. Let’s dive deeper!
The rankings are based on a combination of the number of plays and the unique number of days you listened to them: The top 5 songs and top 5 artists are based on playcount. The ranking of the top 100 songs playlist is initially sorted by playcount, but after track 10, we apply some artist separation so it’s not a direct reflection of playcount.
Cool! Artist separation, for those playing along at home, is basically there to make sure that if you perhaps listened to Fred again..’s entire discography, your top 40 tracks wouldn’t just be Fred again.. tracks.
Let’s look at some numbers for my playlist. Top 5 tracks are:
| track_name | artist | first_discovered | total_listens1 | |
|---|---|---|---|---|
| Out Here with Us | Parra for Cuva | April 11, 2019 14:33:28 | 15 | |
| Ordel | Parra for Cuva | February 10, 2021 11:10:00 | 11 | |
| Both Of Us - Edit | Jayda G | October 16, 2020 16:47:39 | 13 | |
| Dermot (See Yourself in My Eyes) | Fred again.. | April 16, 2021 11:47:31 | 36 | |
| Kyle (I Found You) | Fred again.. | December 15, 2020 14:35:22 | 61 |
Only one of those tracks is new for 2021. Several tracks out of the 100 have only 1 or 2 plays, but they’re tracks by much-loved artists (Bicep, Gilligan Moss), so it wasn’t surprising to see them on the playlist. It feels like a relatively good reflection of my year in music, notwithstanding the lack of the last 2 months of the year.
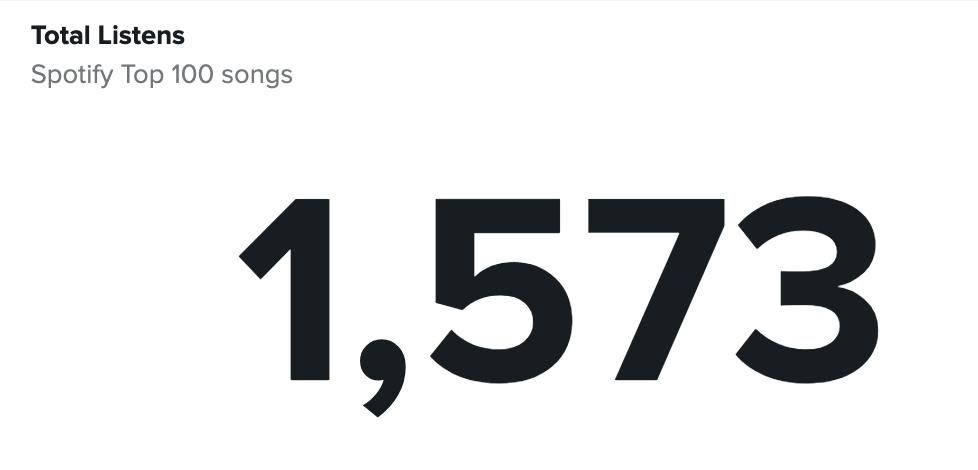
The playlist of 100 songs represents about 56 total unique artists, 32 of whom I discovered in 2021. I ended up buying at least 57 of those top 100 tracks, making it clear that they were important to me (consumerism is certainly a reflection of value in this context).
My top albums of 2021 #
I didn’t expect to see Max Richter’s Sleep album on here, but what it turns out happened there is that it’s an 8.5 hour album, and Fred again.. used a couple songs to soundtrack some instagram stories that he posted, so I put on the album and got to work. What ordinarily might have indicated a multi-day or multi-week obsession with an album that was 13-20 tracks long was actually a one or two day jaunt through an album with 31 tracks.
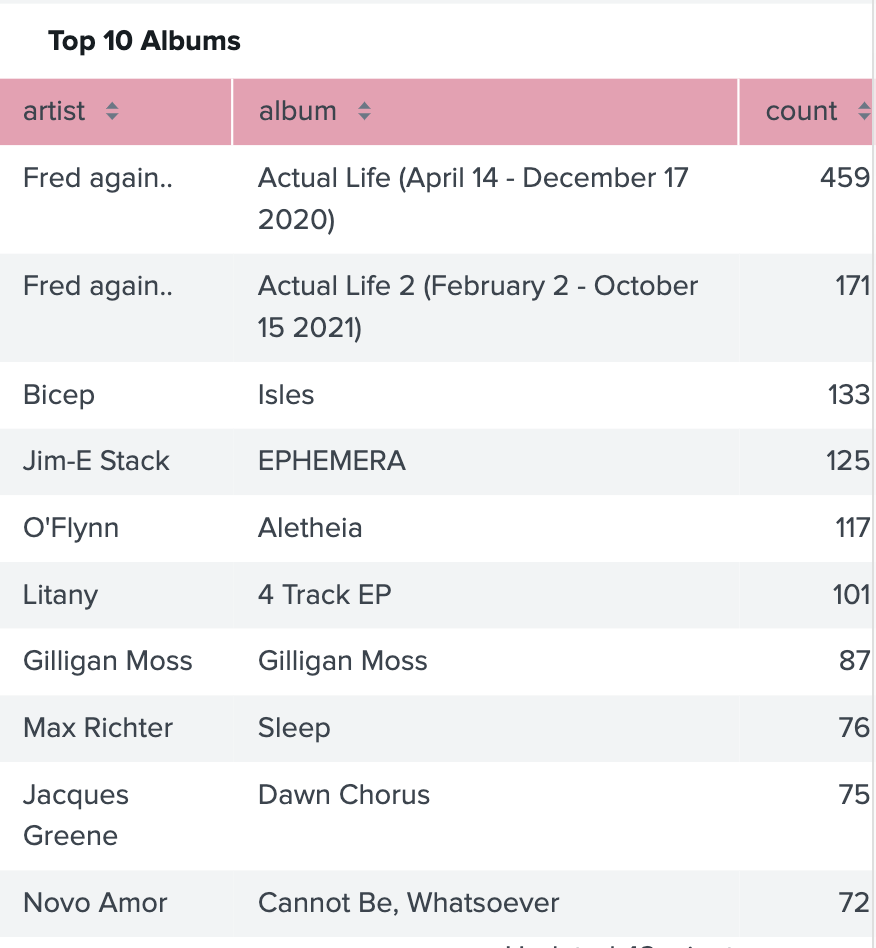
You can see that difference played out when you compare the top 10 albums by number of listens to the top 10 albums by consistency. What’s entertaining to me is that half of the consistently-listened-to albums are full albums, but the other half are singles or EPs.
What were the _best_ albums of 2021 in my opinion? Probably (in an unranked list):
- Bicep - Isles
- DJ Seinfeld - Mirrors
- Fred again.. - Actual Life (April 14 - December 17 2020)
- Fred again.. - Actual Life 2 (February 2 - October 15 2021)
- Gilligan Moss - Gilligan Moss
- Lil Nas X - Montero
Best EPs:
- TSHA - OnlyL
- Jim E-Stack - EPHEMERA
- Logic1000 - You’ve Got the Whole Night to Go
Best single:
- salute - Want U There
- Caribou - You Can Do It
BPM and its flaws #
I asked on Instagram what types of data people were interested in learning more about, and one person asked for BPM data! This is a fun one, honestly, because BPM data is surprisingly hard to come by.
Spotify doesn’t include BPM data in its Spotify Wrapped, although it does include BPM as a “tempo” field in track metadata. Last.fm doesn’t store BPM data, and only tracks that I’ve purchased on Beatport (not iTunes or Bandcamp) include BPM in their metadata.
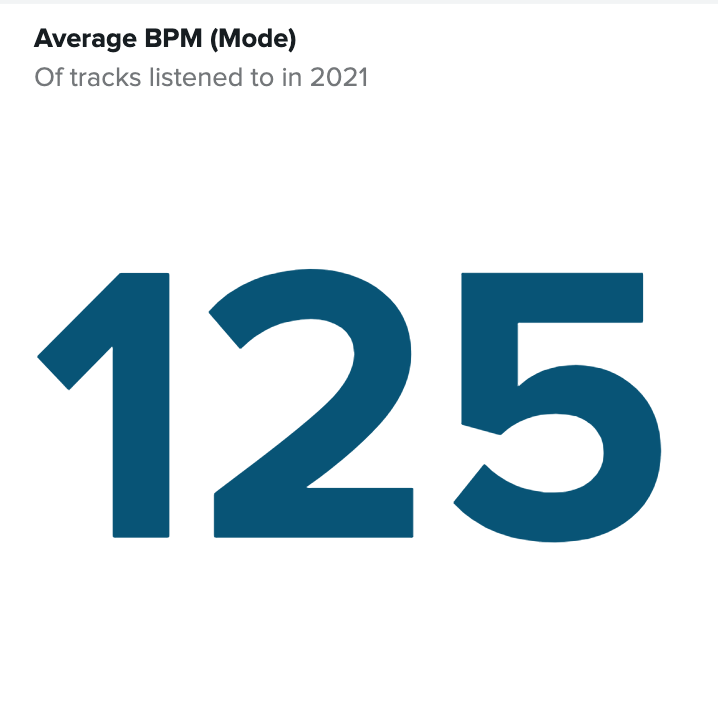
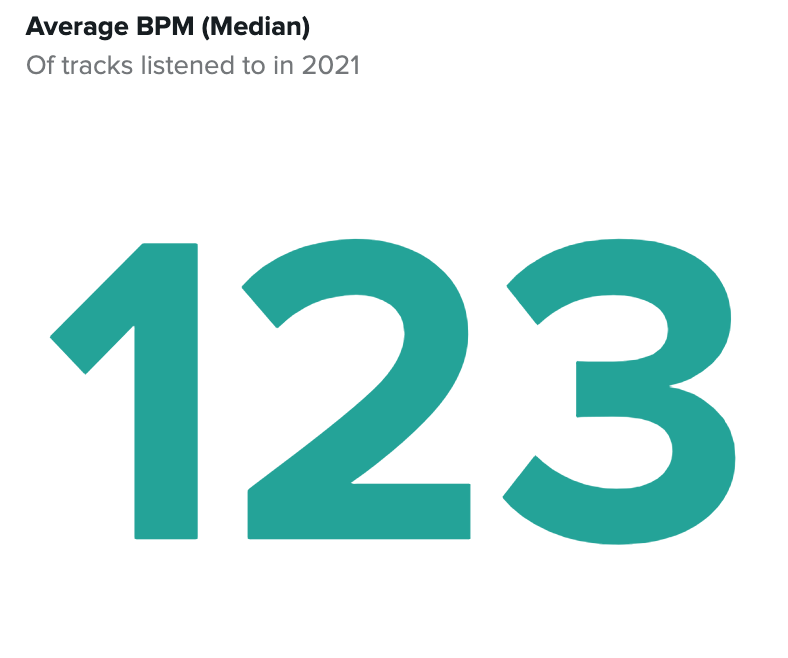
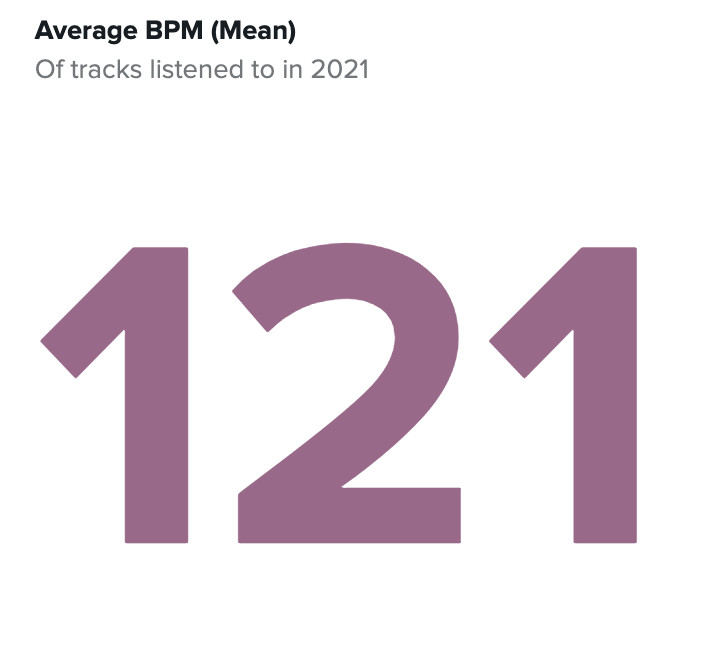
So I can calculate some limited stats based on the tracks that I’ve purchased in 2021, which is a grand total of 42 tracks. Based on those tracks, the average BPM of what I listen to is quite clearly “house music”. But of course, that’s going to be heavily biased towards dance tracks, because Beatport is a purchasing site of last resort for me, and also pretty much only sells music intended for DJing (it’s tough to find the non-extended version of a track there).
Highlights of discovered artists #
I discovered a whopping 1369 artists this year. Fewer than last year, and still a good number of those are random things I watched on YouTube that were incorrectly scrobbled as tracks, like “AI BREAKS NES TETRIS!” or “Climbing with #1 Arctic Elite force” or even “Engineer Explains Every Roller Coaster For Every Thrill”.
Some other artists end up showing up as new discoveries due to how data is stored, such as: “Bleachers, Organized Noize” or “Brittany Howard, Joy Anonymous & Fred again..”. I discussed why this happens in my post about this last year as well.
There’s no easy way for me to clean this data up, and because I’m not really using this data for anything more than my own entertainment, the incentive to invest the time to clean it is very low.
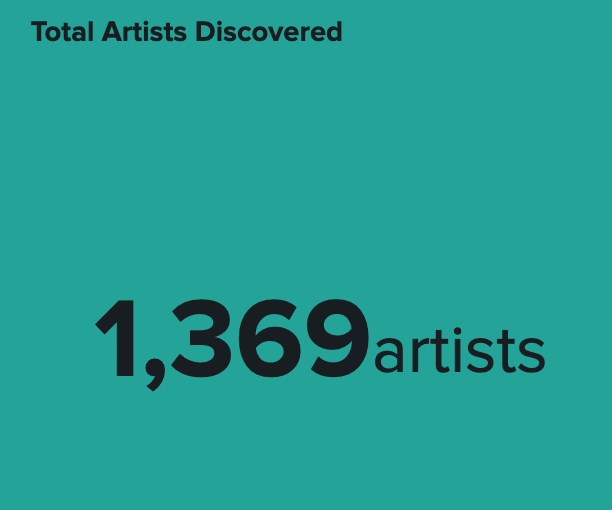
Spotify didn’t share how many artists I discovered this year, but a good number of them were on Spotify, but many of the notable discoveries were facilitated by Spotify (as in, I went to Spotify to listen to them first) but the conduit for discovery was not entirely through Spotify’s algorithms.
Some notable discoveries from my top 20 discovered artists are:
Lil Nas X, whose album Montero was a genre-spanning wonder. My favorite track is probably: Lost in the Citadel, which is a very pop-punk-sounding track.
DJ Seinfeld, who I’d seen live in 2019 as an opener for Jon Hopkins (but was underwhelmed), put out an excellent album Mirrors, which I enjoyed enough to see him live last week. My favorite track by him is These Things Will Come To Be.
Haiku Salut, who showed up on a Discover Weekly playlist with a few catchy tracks. It’s impressive to me how catchy I found it and I ended up buying it that same week, Pattern Thinker.
Moonshine, a DJ collective in Montreal that I discovered while randomly browsing Twitch last year, who put out an album called SMS for Location vol. 4 that I really enjoyed. I recommend their track Woah.
CRi, an Anjunadeep artist who manages to have some very catchy tracks but also leaves me wondering if I’m listening to someone else the whole time. Mysterious. I enjoy this track especially: Friends in Secret.
Everyone You Know, who was another artist hyped by Fred again.. with their collaboration with Joy Anonymous called “Just for the Times”, which is supremely catchy.
Rochelle Jordan, who Tokimonsta recommended on Twitter and whose track Already is a stunner.
Kilder was another random and recent discovery, probably from an algorithmic playlist, and mostly got addicted to his track Don’t Hide.
Sonnee I’m not sure how I encountered, perhaps through a playlist curated by someone. His track So What? has major Tourist vibes.
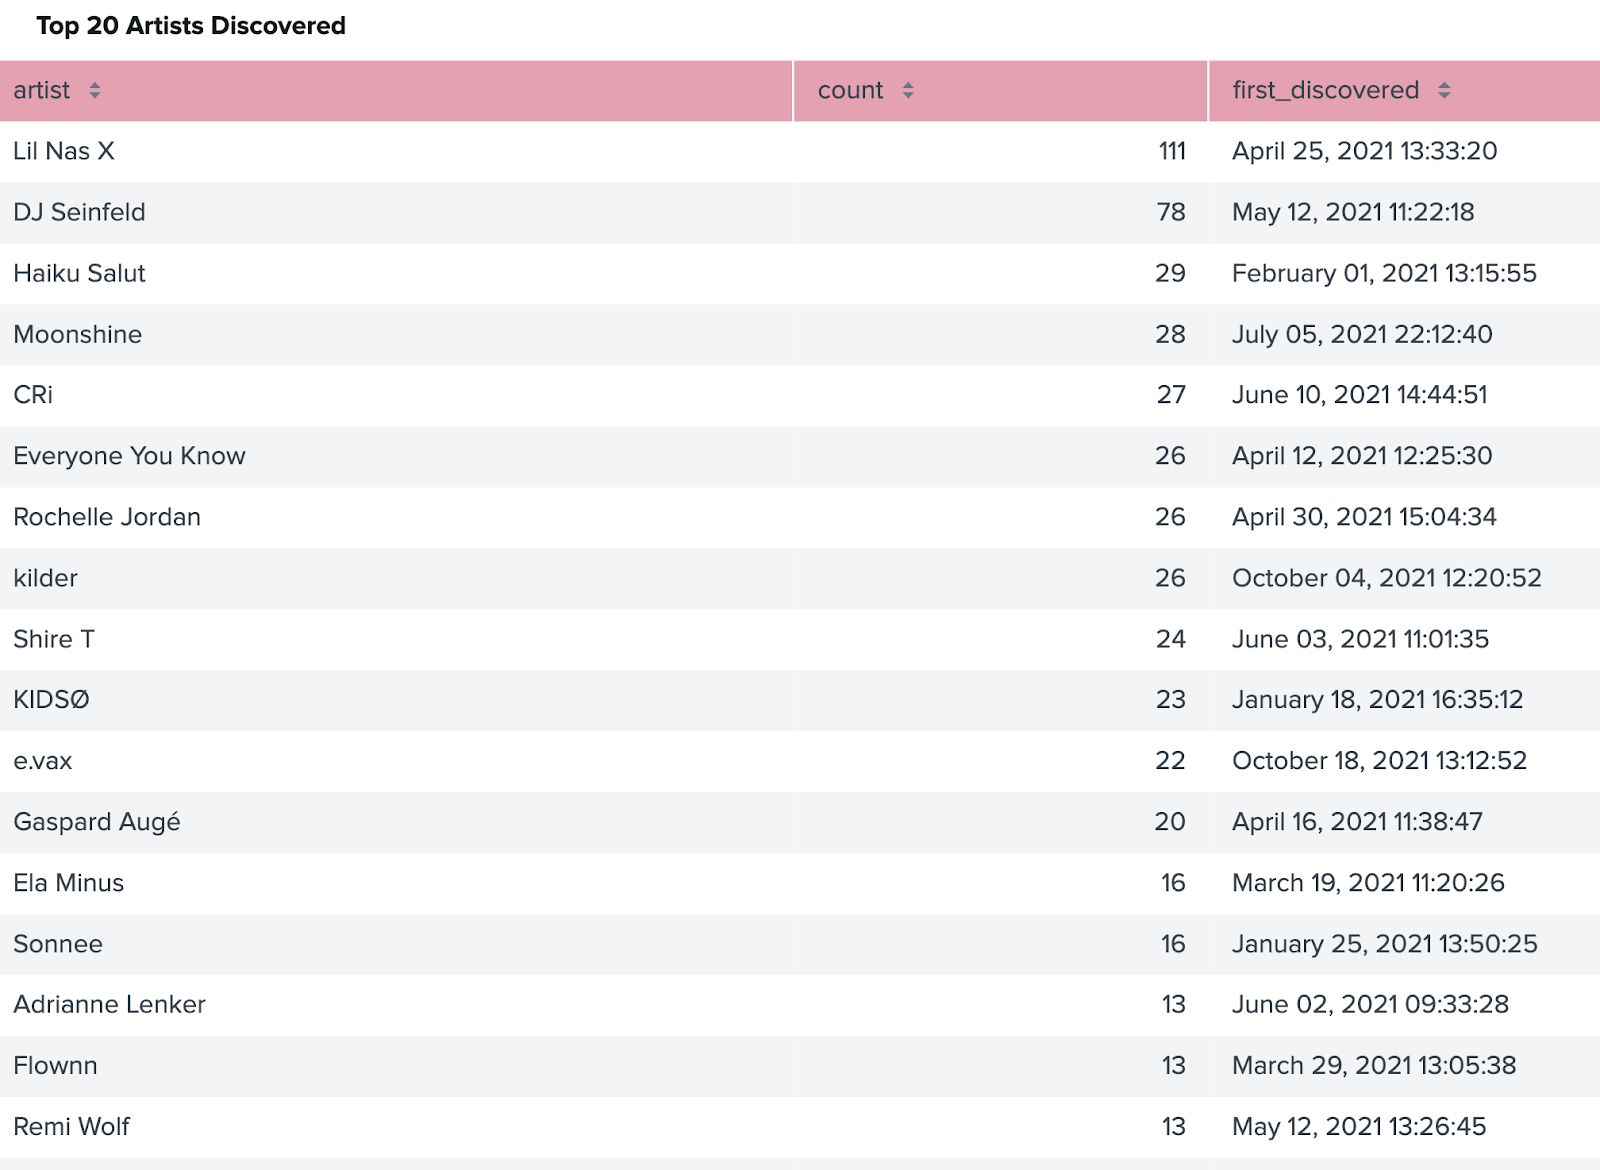
Some of these artist discoveries translated directly into my concert activities (or resulted from seeing what other shows people were going to, with my discovery of Adrianne Lenker).
My year in concerts #
Unlike 2019 and 2018, where I went to nearly a show a week, this year and last year I stayed home most of the time. As things have reopened and venues in San Francisco are required to abide by a vaccination mandate and a mask mandate, I’ve ventured out a few more times this year.
I ended up going to 7 shows and saw a total of 15 artists, some of whom were new to me (Jayda G, Booka Shade, Black Coffee) and others who were familiar (Amtrac, DJ Seinfeld, Jacques Greene).
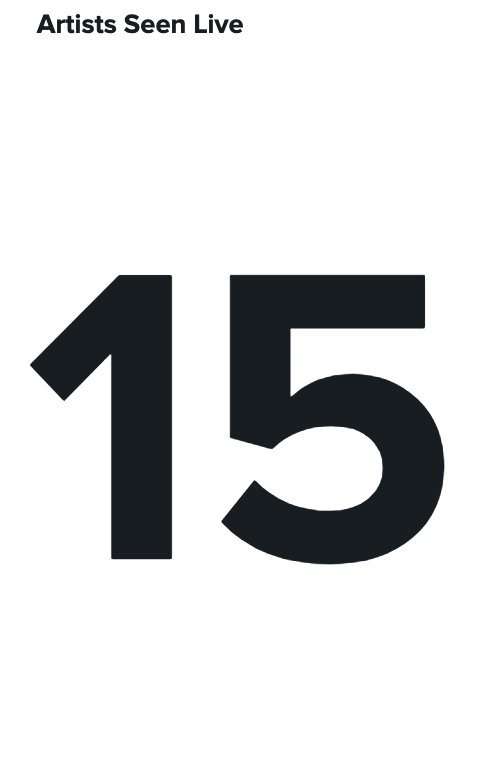

Aside from going to concerts, I’m listening to music pretty consistently, and moreso than in years past (as evidenced by my “minutes listened” metric.
When am I listening to music? #
There are clear trends when I look at WFH years compared to a non-WFH year. When I’m in an office, I listen to less music. Likely because I have the sounds of people to keep me occupied, instead of the sounds of music?

The trend is more clearly relevant to my workdays when you see what time of day I’m listening to music. The starkness of this graph is partially due to the amount of time that a workday is compared with other portions of the day, but the difference is still stark.

What is a workday? Here’s the statement where I define the time of days:
| eval time_of_day=case(in(hour,"10","11","12","13","14","15","16","17"),"probsworkday", in(hour,"18","19","20","21","22"), "4", in(hour,"23","24","00"), "5", in(hour,"01","02","03","04","05","06","07"), "6", in(hour,"08","09"), "1")
| eval time_of_day=case((time_of_day=="probsworkday" AND in(weekday,"1","2","3","4","5")), "2", (time_of_day=="probsworkday" AND in(weekday,"0","6")), "3", time_of_day!="probsworkday", time_of_day)
So essentially, I define a workday as between 10am and 5:59pm on Monday – Friday. This is no longer quite as accurate as it used to be for me, working a new job has me up earlier, but the pattern in the data still holds.
How much money? #
It’s important to dig into how much money Spotify pays artists, especially as half the theme of this post is unpacking the veracity of Spotify’s Wrapped data campaign as it compares to my actual behavior (inasmuch as it’s quantified).
If I assume that every song I listened to this year was one that I streamed on Spotify, and if we use the commonly-reported stat that the average payment to an artist from a single Spotify stream is $0.001128, then that rough math means that:
My individual Spotify streams paid artists a total of $18.61.
I paid Spotify $120 this year to access their service.
Again, that’s assuming that every song I listened to this year, I listened to on Spotify.
Of course, I am a diligent music purchaser. I bought a total of 453 songs (so far) this year.
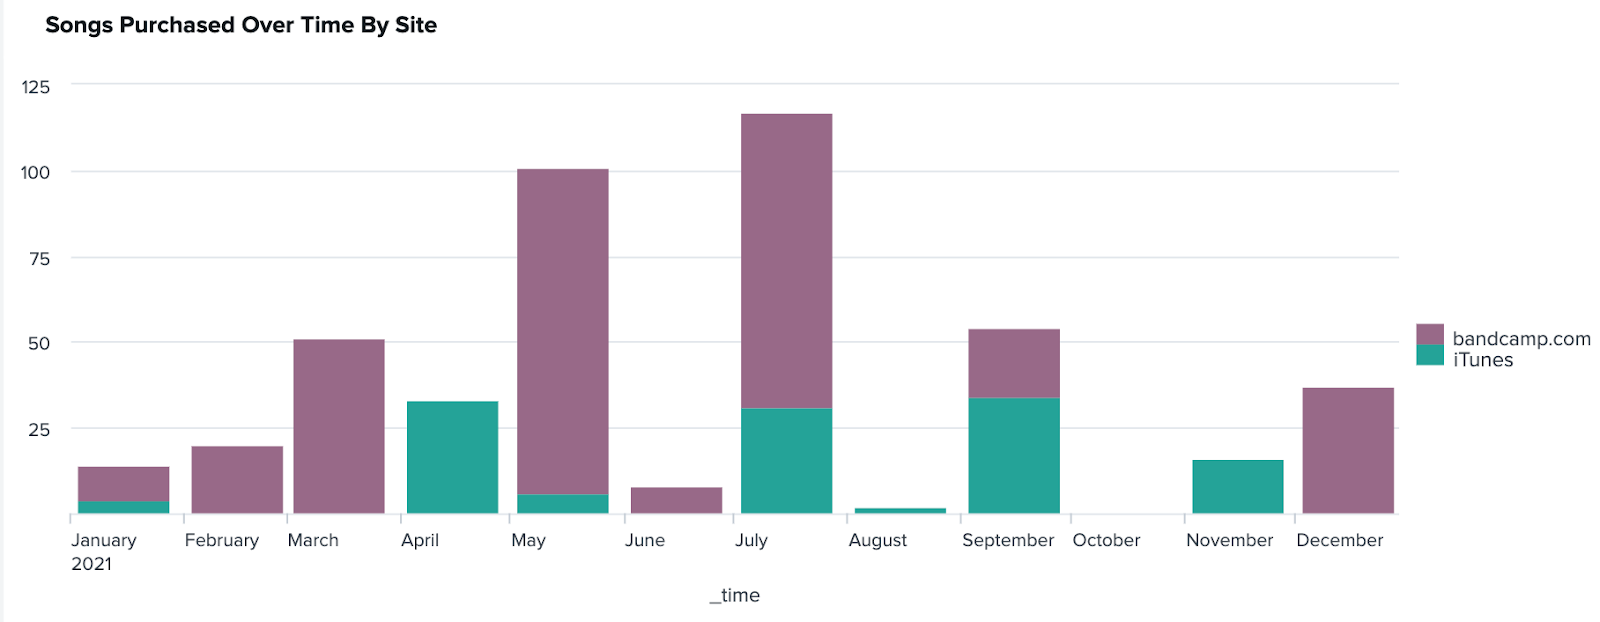
Data caveat: I determine if a song came from Bandcamp by regexing the site URL from the comments of the track. If for some reason a track doesn’t mention that in the comments, well, it’s missing from this data. iTunes data is reliably captured. I also purchase tracks from Beatport, but I have no reliable way of identifying those in the data, and I’m not going to identify those tracks manually, so they’re missing completely from this analysis.
So, let’s make up some more estimates and numbers.
If I assume that every song I bought on Bandcamp cost me $1.50, and I use the quote from the CEO in this Complex interview, 82% of every purchase went to artists. Some music I did purchase on Bandcamp Fridays, which meant more of my money went directly to artists. Some music was cheaper than the $1.50 estimate I’m using here, so given that:
I purchased 327 songs from 104 artists so far this year on Bandcamp.
That produces roughly $402 in profits for the artists.
What I can’t find on Bandcamp, I buy on iTunes (out of convenience, largely). It’s a bit difficult to find consistent stats on what share of an iTunes track purchase makes it to the artist. According to a forum post from 8 years ago, Apple takes 34% of a track cost. The typical iTunes track costs $1.29, except Lil Nas X who made every track on his album $0.69, and the odd $0.99 cent wonder. But let’s take the high estimates! Let’s see how it compares! Given that:
I purchased 126 songs by 30 artists so far this year on iTunes.
That leads to roughly $107 in profits for the artists.
A less charitable number was $0.09 from every track makes it back to the artists. In that case, those artists made $11 from my purchases.

Like I said, most of these numbers are effectively made up. It’s impossible as an individual consumer to know exactly how much of my music consumption activity led to profits for the artists I’m listening to, due to the intricacies of royalties, licensing, and contracts between digital streaming services, labels, artists, producers, songwriters, and more.
It does seem pretty clear, however, that buying music on Bandcamp is always a good idea.
Added commentary #
I cover a lot with this data-driven rundown every year, but the thing that remains constant is my love of music. I love listening to music, discovering new artists, recommending music to friends, and going to live shows and DJ sets.
The latest Money 4 Nothing podcast discussed the way that Spotify Wrapped serves as an emblem of the datafication and financialization of culture, especially whether the number of listens can serve as an adequate proxy for the value of music to a person or a culture.
I think that’s worth considering. These numbers reflect what music and which artists are important to me by virtue of their presence in my life, but that can be separated from what is meaningful or culturally relevant.
There are also limitations to the listening data, given that a large portion of it is algorithmically derived, or derived from an aura reader. This is especially clear given an audio aura described as ecstatic and innovative, yet one of my top artists on Spotify was the sad punk band Smoking Popes. (I highly recommend them if you’re in a wallowing mood).
Data makes experiences seem objective, because they’ve been quantified, but that isn’t actually true. All data is a proxy representation, a measurement of something distinct, and is often an imperfect measurement (how do you objectively measure energy? danceability?). Even the definition of a listen differs across services.
Another point that Saxon Baird and Sam Backer make on their podcast is that with the datafication of habits, the subjectivity of self awareness can be frayed. I agree with this, and also recognize that most things affect the personal subjectivity of what I enjoy listening to. Being in a community of music fans affects which artists I’m apt to highlight as my favorites, or even to reinforce my listening habits as I go about my life. Part of that is just how life works these days, which they point out too, drawing a line between radio and record labels dictating taste whereas now we have Spotify and algorithms largely “curating” for us.
It’s easy for me to recognize that Fred again.. was an objectively and subjectively important artist to me this year, but without the data I might not have remembered that Litany’s 4 track EP was on repeat for several days, or the scope of my brief obsessions with Jim-E Stack’s EP EPHEMERA. There is a component of transactive memory to the quantification for me as well, making it easier for me to remember my subjective experiences better if the “objective” data is being stored for me elsewhere.
That’s all for now. I’ll be here again next year with my annual review of what I listened to, and in the meantime, if you want to know anything else or want a music recommendation, you can find me on Twitter!
-
Total listens according to Last.fm. ↩︎