Define the question: How missing data biases data-driven decisions
This is the eighth and final post in a series about how missing data biases data-driven decisions. Start at the beginning: What’s missing? Reduce bias by addressing data gaps in your analysis process.
In this post, I’ll cover the following:
- Define the question you want to answer for your data analysis process
- How does data go missing when you’re defining your question?
- What can you do about missing data when defining your question?
This post also concludes this blog post series about missing data, featuring specific actions you can take to reduce bias resulting from missing data in your end-to-end data-driven decision-making process.
Define the question #
When you start a data analysis process, you always want to start by deciding what questions you want to answer. Before you make a decision, you need to decide what you want to know.
If you start with the data instead of with a question, you’re sure to be missing data that could help you make a decision, because you’re starting with what you have instead of what you want to know.
Start by carefully defining what you want to know, and then determine what data you need to answer that question. What aggregations and analyses might you perform, and what tools do you need access to in order to perform your analysis?
If you’re not sure how to answer the question, or what questions to ask to make the decisions that you want to make, you can explore best practices guidance and talk to experts in your field. For example, I gave a presentation about how to define questions when trying to prioritize documentation using data (watch on YouTube). If you are trying to monitor and make decisions about software that you’re hosting and managing, you can dig into the RED method for infrastructure monitoring or the USE method.
It’s also crucial to consider whether you can answer that question adequately, safely, and ethically with the data you have access to.
How does data go missing? #
Data can go missing at this stage if it isn’t there at all—if the data you need to answer a question does not exist. There’s also the possibility that the data you want to use to answer a question is incomplete, or you have some, but not all of the data that you need to answer the question.
It’s also possible that the data exists, but you can’t have it—you either don’t have it, or you aren’t permitted to use the data that has already been collected to answer your particular question.
It’s also possible that the data that you do have is not accurate, in which case the data might exist to help answer your question, but it’s unusable, so it’s effectively missing. Perhaps the data is outdated, or the way it was collected means you can’t trust it.
Depending on who funded the data collection, who performed the data collection, and when and why it was performed, can tell you a lot about whether or not you can use a dataset to answer your particular set of questions.
For example, if you are trying to answer the question “What is the effect of slavery on the United States?”, you could review economic reports, the records from plantations about how humans were bought and sold, and stop there. But you might be better off considering who created those datasets, who is missing from those datasets, and whether or not those datasets are useful to answer your question, and which datasets might be missing entirely because they were never created, or what records did exist were destroyed. You might also want to consider whether or not it’s ethical to use data to answer specific questions about the lived experiences of people.
Or, for another grim example, if you want to understand how American attitudes towards Muslims changed after 9/11, you could (if you’re Paul Krugman) look at hate crime data and stop there. Or, as Jameel Jaffer points out in a Twitter thread, you could consider whether or not hate crime data is enough to represent the experience of Muslims after 9/11, considering that “most of the “anti-Muslim sentiment and violence” was *officially sanctioned*” and therefore, all of that is missing from an analysis that focuses solely on hate crime data. Jaffer continues by pointing out that,
“For example, hundreds of Muslim men were rounded up in New York and New Jersey in the weeks after 9/11. They were imprisoned without charge and often subject to abuse in custody because of their religion. None of this would register in any hate crimes database.”
Data can also go missing if the dataset that you choose to use to answer your question is incomplete.
Incomplete dataset by relying only on digitized archival films #
As Rick Prelinger laments in a tweet—if part of a dataset is digitized, often that portion of the dataset is used for data analysis (or research, as the case may be), with the non-digitized portion ignored entirely.

For example, if I wanted to answer the question “What are common themes in American television advertising in the 1950s”? I might turn to the Prelinger Archives, because they make so much digitized archival film footage available. But just because it’s easily accessible doesn’t make it complete. Just because it’s there doesn’t make it the best dataset to answer your question.
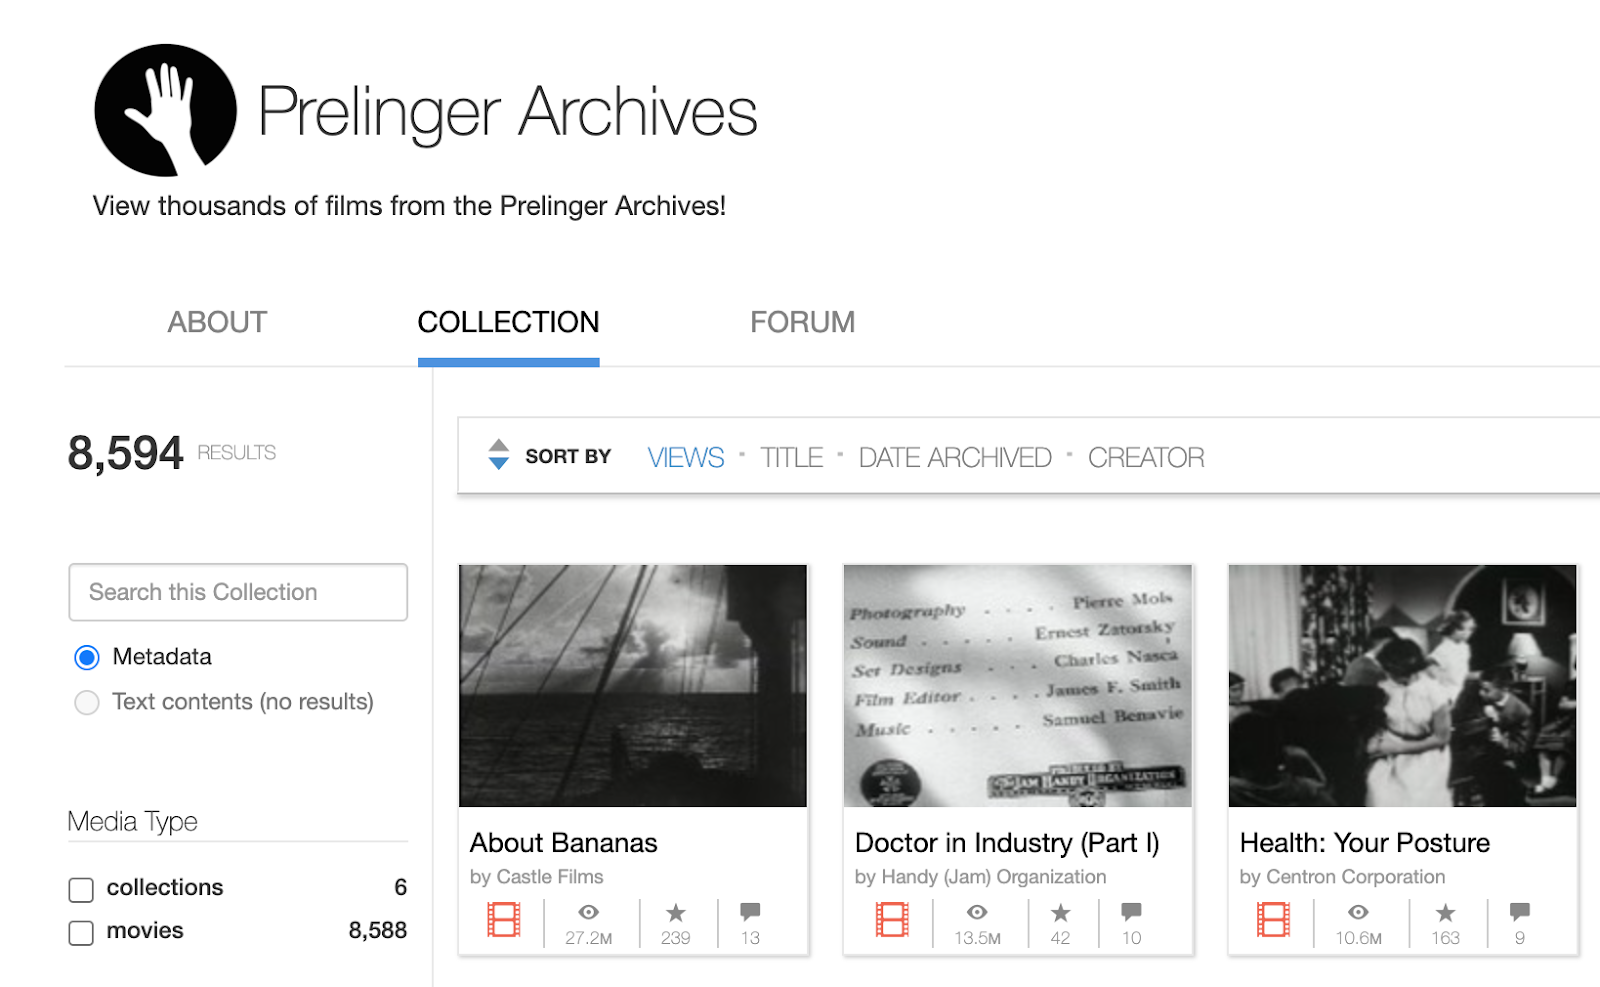
It’s possible that the Prelinger Archives don’t have enough film footage for me to answer such a broad question. In this case, I can supplement the dataset available to me with information that is harder to find, such as by tracking down those non-digitized films. I can also choose to refine my question to focus on a specific type of film, year, or advertising agency that is more comprehensively featured in the archive, narrowing the scope of my analysis to focus on the data that I have available. I could even choose a different dataset entirely, if I find one that more comprehensively and accurately answers my question.
Possibly the most common way that data can go missing when trying to answer a question is that the data you have, or even all of the data available to you, doesn’t accurately proxy what you want to know.
Inaccurate proxy to answer a question leads to missing data #
If you identify data points that inaccurately proxy the question that you’re trying to answer, you can end up with missing data. For example, if you want to answer the question, “How did residents of New York City behave before, during, and after Hurricane Sandy?”, you might look at geotagged social media posts.
Kate Crawford discusses a study Nir Grinberg, Mor Naaman, Blake Shaw, and Gilad Lotan, Extracting Diurnal Patterns of Real World Activity from Social Media, in the context of this question in her excellent 2013 article for Harvard Business Review, The Hidden Biases in Big Data.
As she puts it,
“consider the Twitter data generated by Hurricane Sandy, more than 20 million tweets between October 27 and November 1. A fascinating study combining Sandy-related Twitter and Foursquare data produced some expected findings (grocery shopping peaks the night before the storm) and some surprising ones (nightlife picked up the day after — presumably when cabin fever strikes). But these data don’t represent the whole picture.”
Because the users of social media, especially those that use Twitter and Foursquare and share location data with those tools, only represent a specific slice of the population affected by Hurricane Sandy. And that specific slice is not a representative or comprehensive slice of New York City residents. Indeed, as Crawford makes very clear:
“there was much more going on outside the privileged, urban experience of Sandy that Twitter data failed to convey, especially in aggregate.”
The dataset of geotagged social media posts only represents some residents of New York City, and not in a representative way, so it’s an inaccurate proxy for the experience of all New York City residents. This means data is missing from the question stage of the data analysis step. You want to answer a question about the experience of all New York City residents, but you only have data about the experience of New York City residents that shared geotagged posts on social media during a specific period of time.
The risk is clear—if you don’t identify the gaps in this dataset, you might draw false conclusions. Crawford is careful to point this out clearly, identifying that:
“The greatest number of tweets about Sandy came from Manhattan. This makes sense given the city’s high level of smartphone ownership and Twitter use, but it creates the illusion that Manhattan was the hub of the disaster.”
When you identify the gaps in the dataset, you can understand what limitations exist in the dataset, and thus how you might draw false and biased conclusions. You can also identify new datasets to examine or groups to interview to gather additional data to identify the root cause of the missing data (as discussed in my post on data gaps in data collection).
The gaps in who is using Twitter, and who is choosing to use Twitter during a natural disaster, are one way that Twitter data can inaccurately proxy a population that you want to research and thus cause data to go missing. Another way that it can cause data to go missing is by inaccurately representing human behavior in general because interactions with the platform itself are not neutral.
As Angela Xiao Wu points out in her blog post, How Not to Know Ourselves, based on a research paper she wrote with Harsh Taneja:
“platform log data are not “unobtrusive” recordings of human behavior out in the wild. Rather, their measurement conditions determine that they are accounts of putative user activity — “putative” in a sense that platforms are often incentivized to keep bots and other fake accounts around, because, from their standpoint, it’s always a numbers game with investors, marketers, and the actual, oft-insecure users.”
Put another way, you can’t interpret social media interactions as neutral reflections of user behavior due to the mechanisms a social media platform uses to encourage user activity. The authors also point out that it’s difficult to identify if social media interactions reflect the behavior of real people at all, given the number of bot and fake accounts that proliferate on such sites.
Using a dataset that inaccurately proxies the question that you’re trying to answer is just one way for data to go missing at this stage. What can you do to prevent data from going missing as you’re devising the questions you want to ask of the data?
What can you do about missing data? #
Most importantly, redefine your questions so that you can use data to answer them! If you refine the questions that you’re trying to ask into something that can be quantified, it’s easier to ask the question and get a valid, unbiased, data-driven result.
Rather than try to understand the experience of all residents of New York City before, during, and after Hurricane Sandy, you can constrain your efforts to understand how social media use was affected by Hurricane Sandy, or how users that share their locations on social media altered their behavior before, during, and after the hurricane.
As another example, you might shift from trying to understand “How useful is my documentation?” to instead asking a question that is based on the data that you have: “How many people view my content?”. You can also try making a broad question more specific. Instead of asking “Is our website accessible?”, instead ask, “Does our website meet the AA standard of web content accessibility guidelines?”
Douglas Hubbard’s book, How to Measure Anything, provides excellent guidance about how to refine and devise a question that you can use data analysis to answer. He also makes the crucial point that sometimes it’s not worth it to use data to answer a question. If you are fairly certain that you already know the answer to a question, and the amount of effort it would take to perform data analysis (let alone perform it well) will take a lot of time and resources, it’s perhaps not worth attempting to answer the question with data at all!
You can also choose to use a different data source. If the data that you have access to in order to answer your question is incomplete, inadequate, inaccurate, or otherwise missing data, choose a different data source. This might lead you to change your dataset choice from readily-available digitized content to microfiche research at a library across the globe in order to perform a more complete and accurate data analysis.
And of course, if a different data source doesn’t exist, you can create a new data source with the information you need. Collaborate with stakeholders within your organization, make a business case to a third-party system that you want to gather data from, use freedom of information act (FOIA) requests to gather data that exists but is not easily-accessible to create a dataset.
I also want to take care to acknowledge that choosing to use or create a different dataset can often require immense privilege—monetary privilege to fund added data collection, a trip across the globe, or a more complex survey methodology; privilege of access, to have access to others doing similar research and are willing to share data with you; and privilege of time to perform the added data collection and analysis that might be necessary to prevent missing data.
If the data exists but you don’t have permission to use it, you might devise a research plan to request access to sensitive data, or work to gain the consent of those in the dataset that you want to use to allow you to use the data to answer the question that you want to answer. This is another case where communicating the use case of the data can help you gather it—if you share the questions that you’re trying to answer with the people that you’re trying to collect data from, they may be more inclined to share it with you.
Take action to reduce bias in your data-driven decisions from missing data #
If you’re a data decision-maker, you want to take these steps to take action:
- Define the questions being answered with data.
- Identify missing data in the analysis process.
- Ask questions of the data analysis before making decisions.
If you carefully define the questions guiding the data analysis process, clearly communicating your use cases to the data analysts that you’re working with, you can prevent data from going missing at the very start.
Work with your teams and identify where data might go missing in the analysis process, and do what you can to address a leaky analysis pipeline.
Finally, ask questions of the data analysis results before making decisions. Dig deeper into what is communicated to you, seek to understand what might be missing from the reports, visualizations, and analysis results being presented, and whether or not that missing data is relevant to your decision.
If you work with data as a data analyst, engineer, admin, or communicator, you can take these steps to take action:
- Steward and normalize data.
- Analyze data at multiple levels of aggregation and time spans.
- Add context to reports and communicate missing data.
Responsibly steward data as you collect and manage it, and normalize it when you prepare it for analysis to make it easier to use.
If you analyze data at multiple levels of aggregation and time spans, you can determine which level allows you to communicate the most useful information with the least amount of data going missing, hidden by overgeneralized aggregations or overlarge time spans, or hidden in the noise of overly-detailed time spans or too many split-bys.
Add context to the reports that you produce, providing details about the data analysis process and the dataset used, acknowledging what’s missing and what’s represented. Communicate missing data with detailed and focused visualizations, keeping visualizations consistent for regularly-communicated reports.
I hope that no matter your role in the data analysis process, this blog post series helps you reduce missing data and make smarter, more accurate, and less biased data-driven decisions.