Analyze the data: How missing data biases data-driven decisions
This is the fifth post in a series about how missing data biases data-driven decisions. Start at the beginning: What’s missing? Reduce bias by addressing data gaps in your analysis process.
When you do data analysis, you’re searching and analyzing your data so that you can answer a specific question with the data so that you can make a decision at the end of the process. Unfortunately, there are many ways that data can go missing while you analyze it.
In this post, I’ll cover the following
- Why disaggregation matters when performing data analysis
- How data goes missing when analyzing data
- What to do about missing data when analyzing data
- How simple mistakes can cause data to go missing
Declining bird populations in North America #
Any aggregation that you do in your data analysis can cause data to go missing. I recently finished listening to the podcast series The Last Archive, by Jill Lepore, and episode 9 talked about declining bird populations in North America. I realized that it’s an excellent example of why disaggregating data is vital to making sure that data doesn’t go missing during the analysis process.
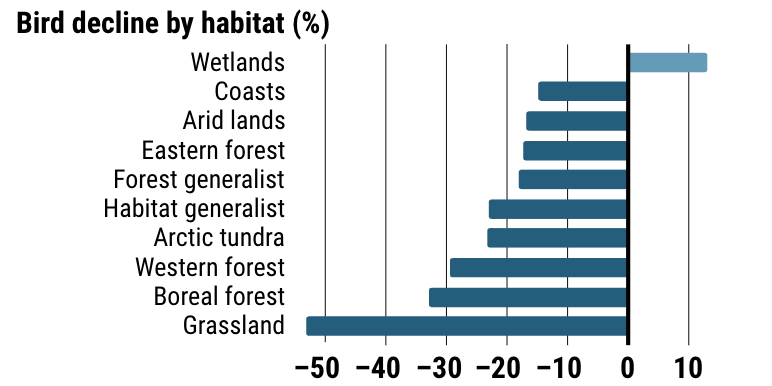
As reported in Science Magazine, scientists have concluded that since 1970, the continent of North America has lost 3 billion birds—nearly 30% of the surveyed total. But what does that mean for specific bird populations? Are some more affected than others?
It’s easy for me to look around San Francisco and think, well clearly that many birds can’t be missing—I’m still surrounded by pigeons and crows, and ducks and geese are everywhere when I go to the park!
If you don’t disaggregate your results, there’s no way to determine which bird breeds are affected and where. You might assume that 30% of all bird breeds were equally affected across habitats and types. Thankfully, these scientists did disaggregate their results, so we can identify variations that otherwise would be missing from the analysis.
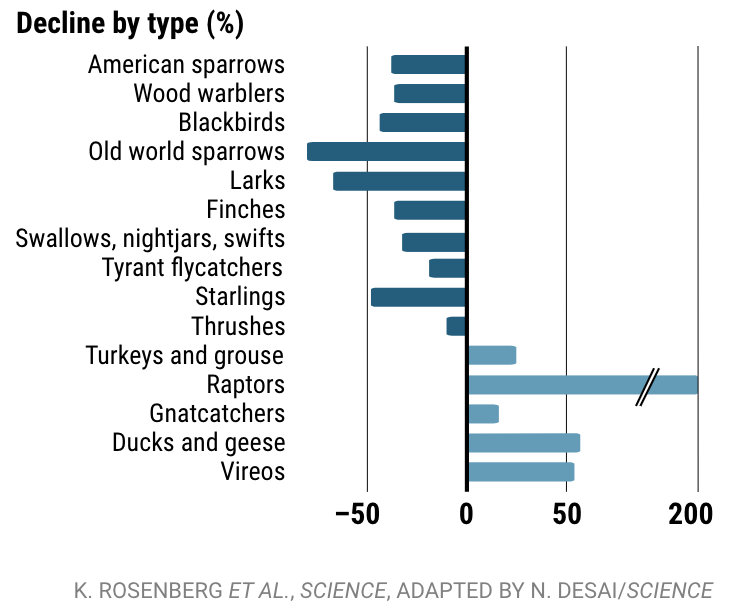
In the case of this study, we can see that some bird populations—Old world sparrows, Larks, and Starlings—are more affected than other types of birds, while others—Raptors, Ducks and geese, and Vireos—have flourished in the past 50 years.
Because the data is disaggregated, you can uncover data that would otherwise be missing from the analysis—how the different types of birds have actually been differently affected, due to habitat loss in grasslands, or cases where restoration and rehabilitation efforts have been effective, such as the resurgence in the population of raptors.
Without an understanding of which specific bird populations are affected, and where they live, you can’t take as effective action to help bird populations recover, because you’re missing too much data due to an overgeneralized aggregate. Any decisions you took based on the overgeneralized aggregate would be biased and ultimately incorrect.
In the case of this study, we know that targeted bird population restoration is perhaps most needed in grasslands habitats, like the Midwest where I grew up.
Unfortunately, the study only covers 76% of all bird breeds, so my city-dwelling self, will just continue to wonder how the bird population has changed since 1970 for pigeons, doves, crows, and others.
How does data go missing? #
An easy way for data to go missing is for incomplete data to be returned when you’re analyzing the data. Many of these examples are Splunk-specific, but are limitations shared by most data analysis tools.
Truncated results #
In Splunk, search results could be truncated for a variety of reasons. Truncated results have visible error messages if you’re running ad hoc searches, but you might not see error messages if the searches are producing scheduled reports.
If the indexers where the data is stored are unreachable, or your search times out before completing, the results could be incomplete. If you’re using a subsearch, you might hit the default event limit of 10K events, or the timeout limit of 60 seconds and have incomplete subsearch results. If you’re using the join search command, you might hit the 50K row limit that Nick Mealy discusses in his brilliant .conf talk, Master Joining Datasets Without Using Join.
If you’re searching an external service from Splunk, for example by using ldapsearch or a custom command to search an external database, you might not get complete results if that service is having problems or if you don’t have access to some data that you’re searching for.
It’s surprisingly easy for data to go missing when you’re correlating datasets.
Missing and “missing” fields across datasets #
If you’re trying to compare datasets and some of the datasets are missing fields, you might accidentally miss data. Without the same field across multiple types of data, it can be difficult to perform valuable or accurate data correlations.
In this containerized cloud-native world, tracing outages across systems can be complex if you don’t have matching identifiers in every dataset that you’re using. As another example, it can be difficult to identify suspicious user session activity without the ability to correlate session identifiers with active users logged into a specific host.
Sometimes the fields aren’t actually missing, they’re just named differently. Because the data isn’t normalized, or the fields don’t match your naming expectations, they’re effectively missing from your analysis because you can’t find them.
Missing fields in a dataset that you want to include in your analysis #
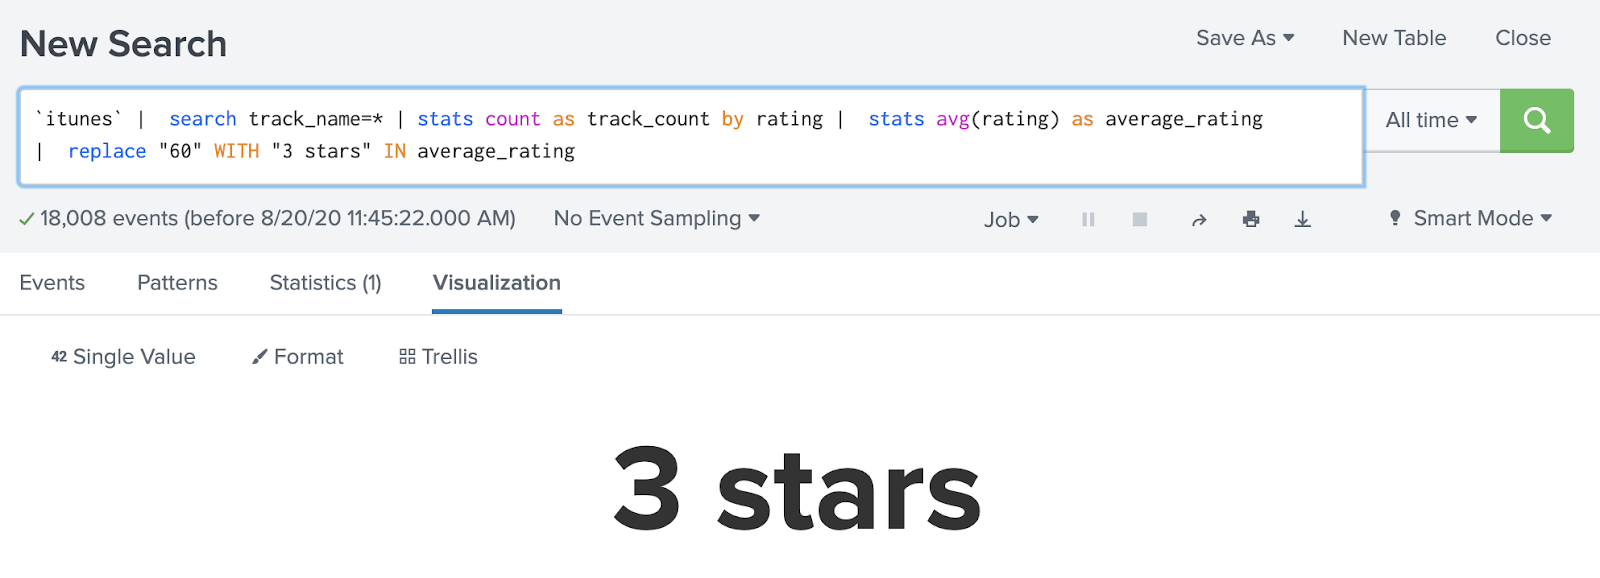
Sometimes data is missing from specific events within a dataset. For example, I wanted to determine the average rating that I gave songs in my iTunes library. However, iTunes XML files store tracks with no rating (or a zero star rating for my purposes) without a rating field at all in the events.
Calculating an average with that data missing gives me an average 3 star rating for all the tracks in my iTunes library.
But if I add the zero-star rated tracks back in, representing those as “tracks I have decided aren’t worthy of a rating” rather than “tracks that have not yet been rated”, the average changes to 2.5 stars per track.
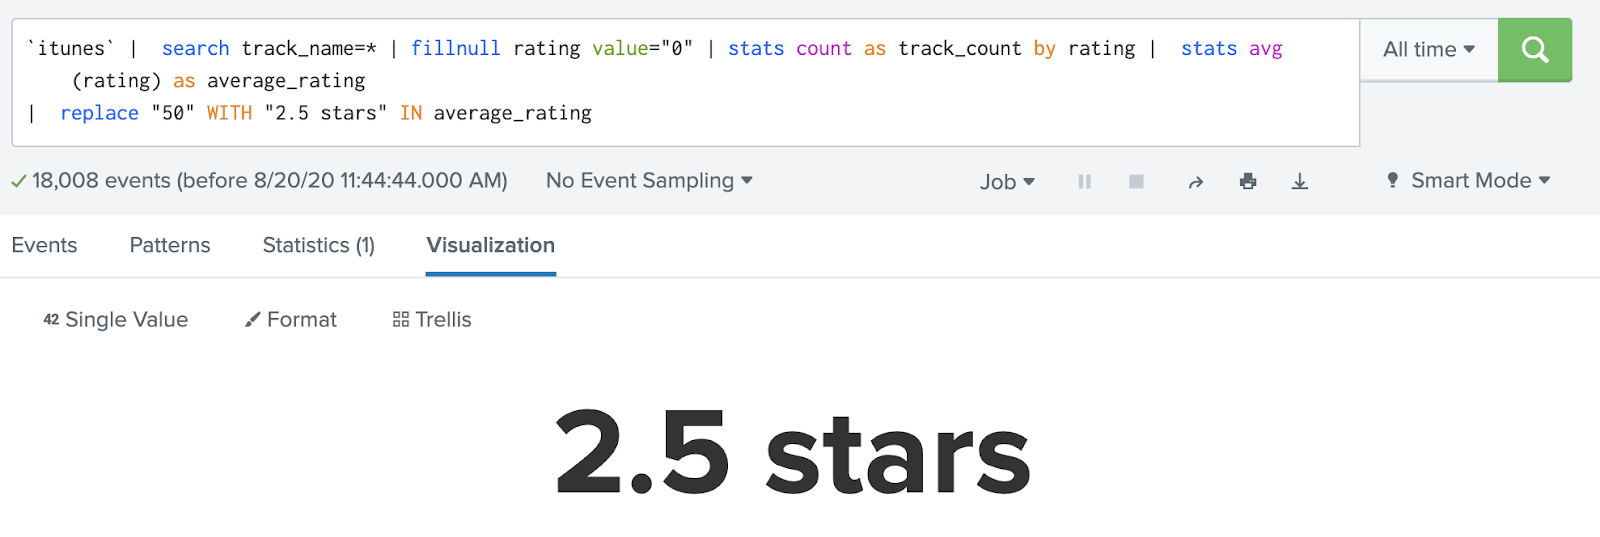
If I’d used the results that were missing data, I’d have a biased interpretation of my average song rating in my iTunes library.
Mismatched numeric units and timezones #
You might also have data that goes missing if you’re improperly analyzing data because you don’t know or misinterpret the units that the data is stored in.
Keep track of whether or not a field contains a time in minutes or seconds and if your network traffic logs are in bytes or megabytes. Data can vanish from your analysis if you improperly compare dissimilar units!
If you convert a time to a more human-readable format and make incorrect assumptions about the time format, such as the time zone that it’s in, you can cause data to go missing from the proper time period.
Even without transforming your data, if you’re comparing different datasets that store time data with different time zones, data can go missing. You might think that you’re comparing a four hour window from last Monday while debugging an issue across several datasets
It’s also important to note that how you choose to aggregate your data can hide data that is missing from your dataset, or hide data in a way that causes it to go missing.
Consider the granularity of your aggregations #
When you perform your data analysis, consider what time ranges you’re using to bin or aggregate your data, the time ranges that you use to search your data across, for what data points, which fields you use to disaggregate your data, and how that might affect your results.
For example, it’s important to keep track of how you aggregate events across time periods in your analysis. If the timespans that you use when aggregating your data don’t align with your use case and the question you’re trying to answer, data can go missing.
In this example, I was trying to convert an existing search that showed me how much music I was listening to by type per year, into a search that would show me how much music I was listening to by weekday by year. Let’s take a look:
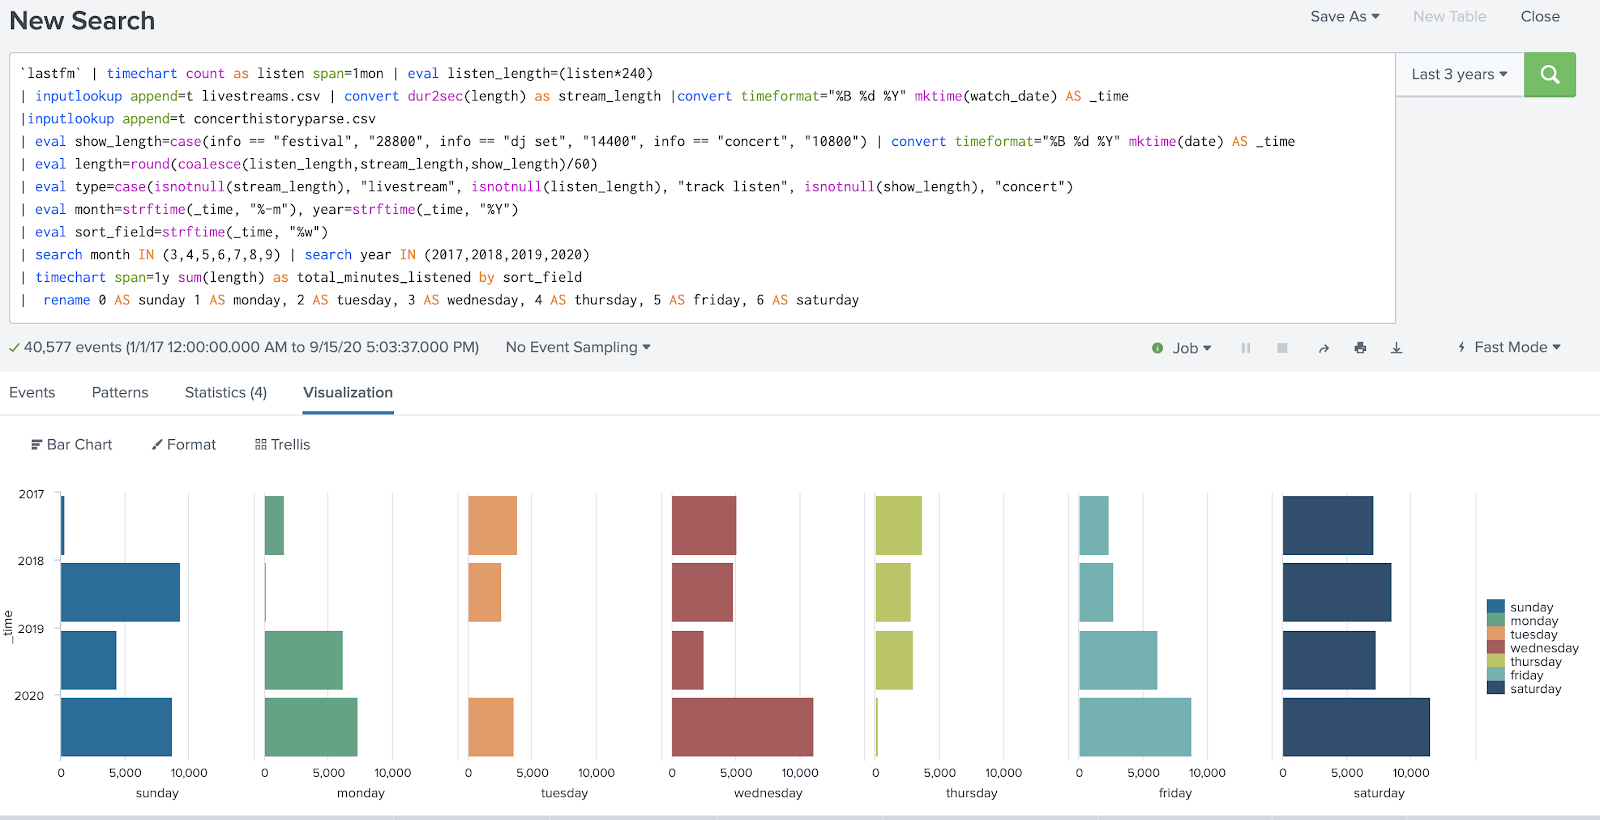
This was my initial attempt at modifying the data, and there’s a lot missing. There’s no results at all for Tuesdays in 2019, and the counts for Sundays in 2017, Mondays in 2018, and Thursdays in 2020 were laughably low. What did I do wrong?
It turned out that the time spans I was using in the original search to aggregate my data were too broad for the results I was trying to get. I was doing a timechart with a span of 1 month to start, and then trying to get data down to the a granularity of weekday. That wasn’t going to work!
I’d caused data to go missing because I didn’t align the question I was trying to answer with the time span aggregation in my analysis.
Thankfully, it was a quick fix. I updated the initial time grouping to match my desired granularity of one day, and I was no longer missing data from my results!
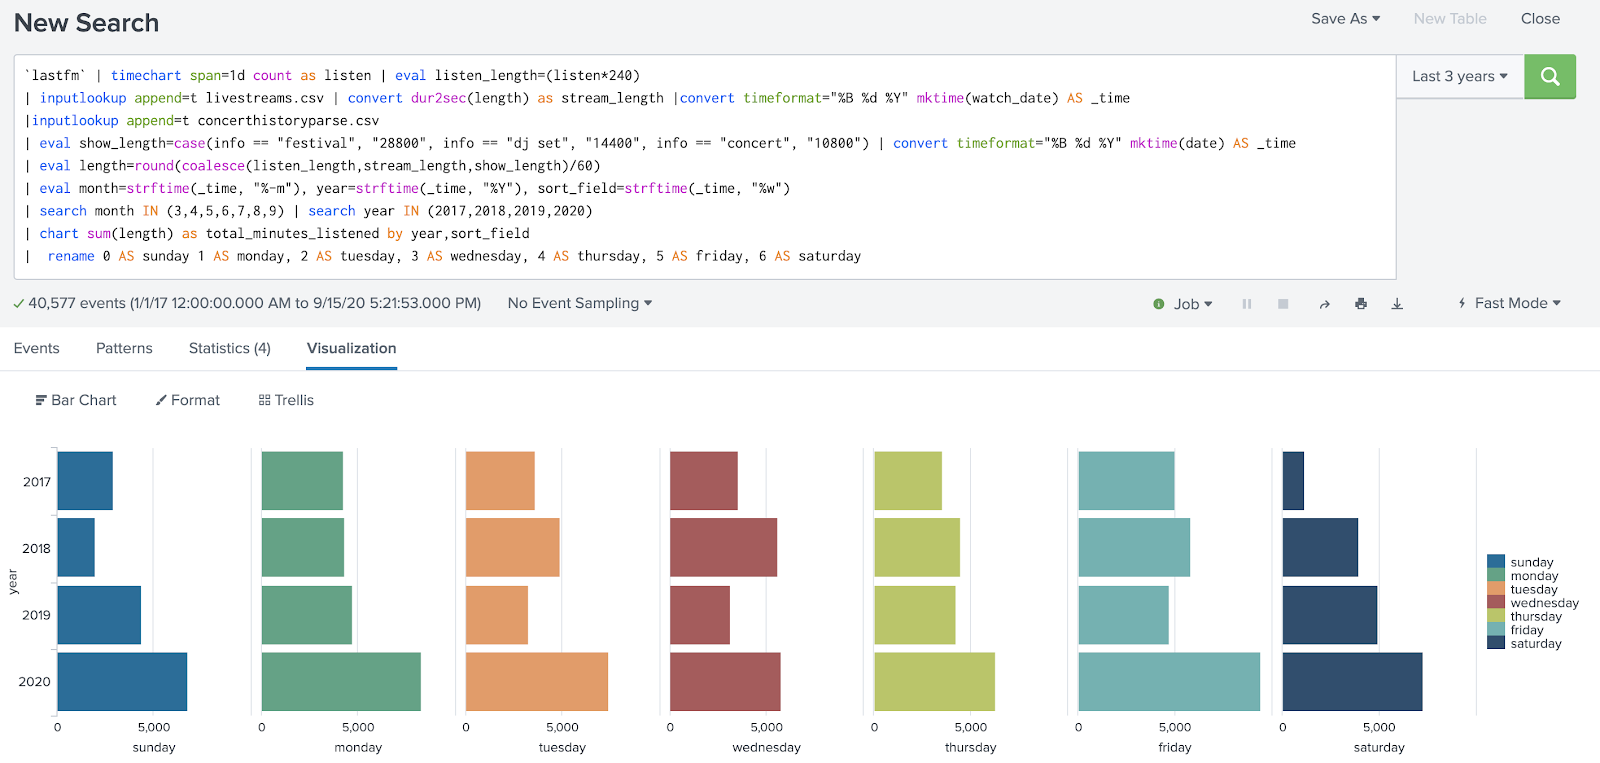
This is a case where an overly broad timespan aggregation, combined with a lack of consideration for my use case, caused data to go missing.
You make an error in your analysis process #
How many of you have written a Splunk search with a conditional eval function and totally messed it up?

In this case, I wrote a search to calculate the duration of music listening activities—specifically, calculating an estimated amount of time spent at a music festival, DJ set, or concert—in order to compare how much time I spent listening to music before I was sheltering in place with after.
I used a conditional “info == concert” to apply an estimated concert length of 3 hours, but no field-value pair of info=concert existed in my data. In fact, concerts had no info field at all. It wasn’t until I’d finished my search, combining 2 other datasets, that I realized a concert I’d attended in March was missing from the results.
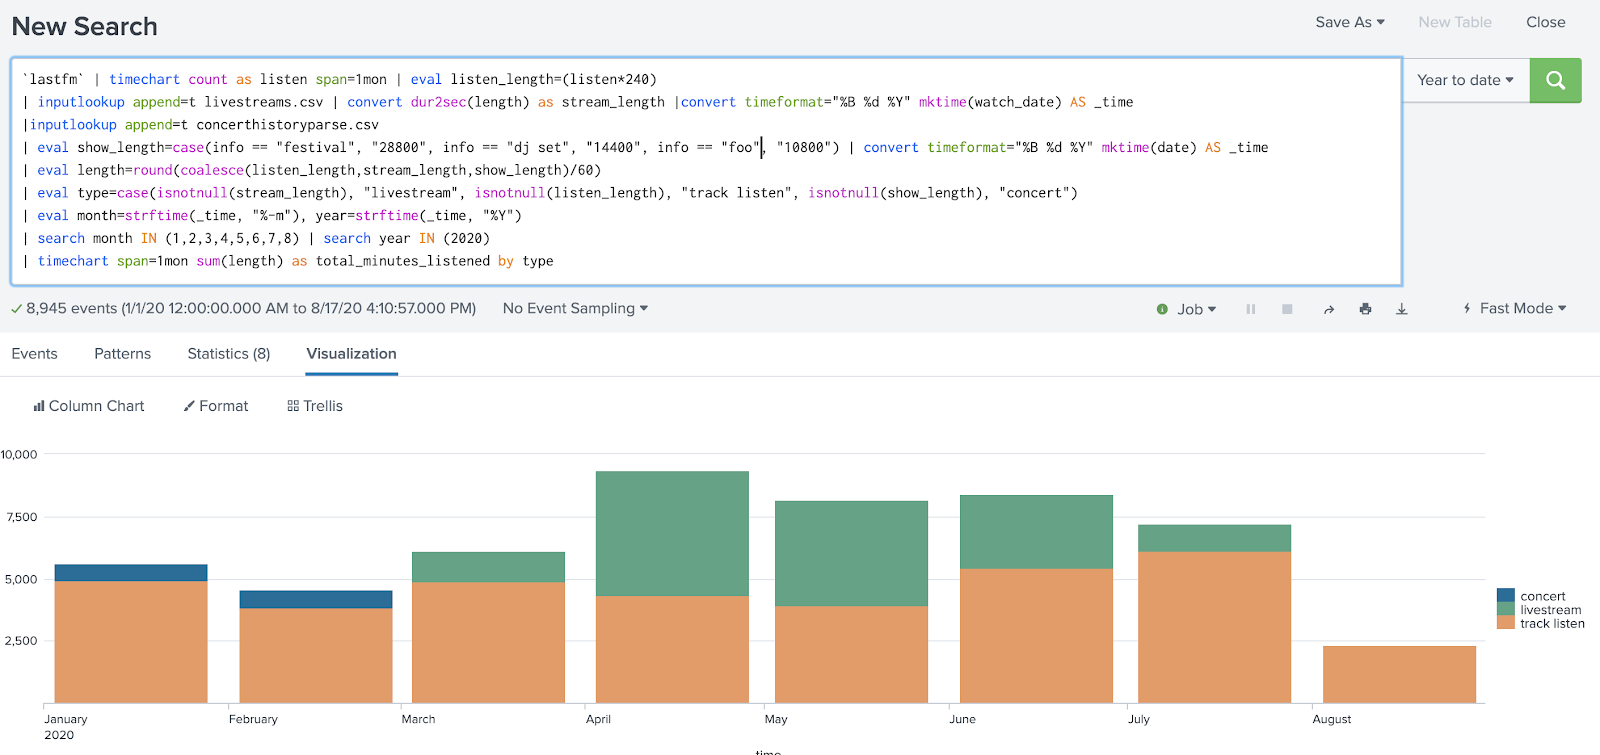
In order to prevent this data from going missing, I had to break my search down into smaller pieces, validating the accuracy of the results at each step against my expectations and knowledge of what the data should reflect. Eventually I realized that I’d caused data to go missing in my analysis process by making the assumption that an info=concert field existed in my data.
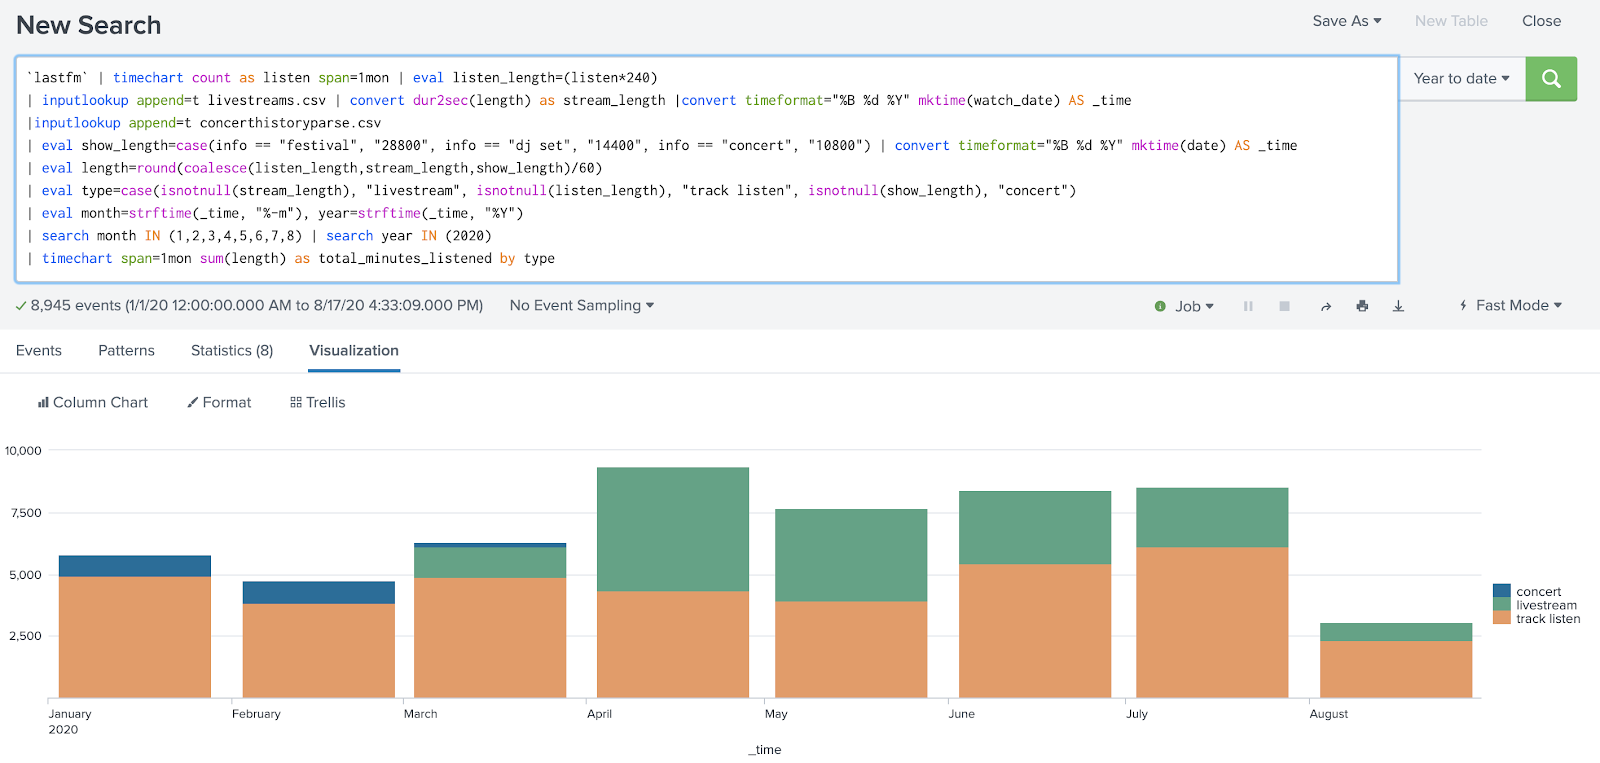
Ironically, this graph is still missing data because Last.fm failed to scrobble tracks from Spotify for several time periods in July and August.
What can you do about missing data? #
If you have missing data in your analysis process, what can you do?
Optimize your searches and environment #
If you’re processing large volumes of events, you can consider expanding limits for data, such as those for subsearches or timeouts for results. Default limits are the most common settings, and aren’t always something to adjust, but occasionally it makes sense to adjust the limits to suit your use cases if your architecture can handle it.
More practically, make sure that you’re running efficient and precise analyses to make the most use of your data analysis environment. If you’re using Splunk, I again recommend Nick Mealy’s excellent .conf talk, Master Joining Datasets Without Using Join for guidance on optimizing your searches, as well as Martin Müller’s talk on the Splunk Job Inspector, featuring Clara Merriman for the .conf20 edition.
Normalize your data #
You can normalize your data to make it easier to use, especially if you’re correlating common fields across many datasets. Use field names that are as accurate and descriptive as possible, but also names that are consistent across datasets.
It’s a best practice to follow a common information model, but also ensure that you work closely with data administrators and data analysts (if you aren’t performing both roles) to make sure that analyst use cases and expectations align with administrator practices and implementations.
If you’re using Splunk, start with the Splunk Common Information Model (CIM) or write your own data model to help normalize fields. Keep in mind too, that you don’t have to use accelerated data models to use a data model when naming fields.
Enrich your datasets #
You can also explore different ways to enrich your datasets earlier in the analysis process to help make sure data doesn’t go missing across datasets. If you perform data enrichment on the data as it streams in, using a tool like Cribl LogStream or Splunk Data Stream Processor, you can add this missing data back to the events and make it easier to accurately and usefully correlate data across datasets.
Consistently validate your results #
Do what you can to consistently and constantly ensure the validity of your search results. Assess the validity against your expectations, but ultimately against itself and against context. If you don’t validate your results, you might lose data that is hidden inside of an aggregate or misinterpreted due to missing context.
- Check different time ranges. What seems to be a gap or a pattern in data could just be seasonality or noise. Consider separating weekends from weekdays, or business hours from other hours, depending on the type of data that you’re aggregating.
- Use different types of averages, and consider whether the span of values in your results are well-represented by an average. An average of a wide range of values can inaccurately reflect the range of the values, effectively hiding the minimum and the maximum values.
- Disaggregate your data to identify where you might be missing more data, and thus have bias in your results. Heather Krause and Shena Ashley discuss disaggregation in an interview for If Data Could Talk by Tableau Software on The Ethics of Visualizing Data on Race, making the point that disaggregated data does not imply causation, it merely describes the data.
- Compare like with like. Validate time zones, units, and the data in similarly-named fields using a data dictionary or by working with the stewards of the datasets to make sure that you’re using the data correctly.
To help ensure you’re properly accounting for missing data that you might cause while analyzing data, work with your data administrator and consult with a statistics expert if you’re not sure you’re properly analyzing or aggregating data. To help learn more, I recommend Ben Jones’ book Avoiding Data Pitfalls: How to Steer Clear of Common Blunders When Working with Data and Presenting Analysis and Visualizations.
The next post in this series covers the different ways that data can go missing at the data management stage—what happens to prepare data for analysis? Manage the data: How missing data biases data-driven decisions.