Reflecting on a decade of (quantified) music listening
I recently crossed the 10 year mark of using Last.fm to track what I listen to.
From the first tape I owned (Train’s Drops of Jupiter) to the first CD (Cat Stevens Classics) to the first album I discovered by roaming the stacks at the public library (The Most Serene Republic Underwater Cinematographer) to the college radio station that shaped my adolescent music taste (WONC) to the college radio station that shaped my college experience (WESN), to the shift from tapes, to CDs, (and a radio walkman all the while), to the radio in my car, to SoundCloud and MP3 music blogs, to Grooveshark and later Spotify, with Windows Media Player and later an iTunes music library keeping me company throughout…. It’s been quite a journey.
Some, but not all, of that journey has been captured while using the service Last.fm for the last 10 years. Last.fm “scrobbles” what you listen to as you listen to it, keeping a record of your listening habits and behaviors. I decided to add all this data to Splunk, along with my iTunes library and a list of concerts I’ve attended over the years, to quantify my music listening, acquisition, and attendance habits. Let’s go.
What am I doing? #
Before I get any data in, I have to know what questions I’m trying to answer, otherwise I won’t get the right data into Splunk (my data analysis system of choice, because I work there). Even if I get the right data into Splunk, I have to make sure that the right fields are there to do the analysis that I wanted. This helped me prioritize certain scripts over others to retrieve and clean my data (because I can’t code well enough to write my own).
I also made a list of the questions that I wanted to answer with my data, and coded the questions according to the types of data that I would need to answer the questions. Things like:
- What percentage of the songs in iTunes have I listened to?
- What is my artist distribution over time? Do I listen to more artists now? Different ones overall?
- What is my listen count over time?
- What genres are my favorite?
- How have my top 10 artists shifted year over year?
- How do my listening habits shift around a concert? Do I listen to that artist more, or not at all?
- What songs did I listen to a lot a few years ago, but not since?
- What personal one hit wonders do I have, where I listen to one song by an artist way more than any other of their songs?
- What songs do I listen to that are in Spotify but not in iTunes (that I should buy, perhaps)?
- How many listens does each service have? Do I have a service bias?
- How many songs are in multiple services, implying that I’ve probably bought them?
- What’s the lag between the date a song or album was released and my first listen?
- What geographic locations are my favorite artists from?
As the list goes on, the questions get more complex and require an increasing number of data sources. So I prioritized what was simplest to start, and started getting data in.
Getting data in… #
I knew I wanted as much music data as I could get into the system. However, SoundCloud isn’t providing developer API keys at the moment, and Spotify requires authentication, which is a little bit beyond my skills at the moment. MusicBrainz also has a lot of great data, but has intense rate-limiting so I knew I’d want a strategy to approach that metadata-gathering data source. I was left with three initial data sources: my iTunes library, my own list of concerts I’ve gone to, and my Last.fm account data.
Last.fm provides an endpoint that allows you to get the recent tracks played by a user, which was exactly what I wanted to analyze. I started by building an add-on for Last.fm with the Splunk Add-on Builder to call this REST endpoint. It was hard. When I first tried to do this a year and a half ago, the add-on builder didn’t yet support checkpointing, so I could only pull in data if I was actively listening and Splunk was on. Because I had installed Splunk on a laptop rather than a server in ~ the cloud ~, I was pretty limited in the data I could pull in. I pretty much abandoned the process until checkpointing was supported.
After the add-on builder started supporting checkpointing, I set it up again, but ran into issues. Everything from forgetting to specify the from date in my REST call to JSON path decision-making that meant I was limited in the number of results I could pull back at a time. I deleted the data from the add-on sourcetype many times, triple-checking the results each time before continuing.
I used a python script (thanks Reddit) to pull my historical data from Last.fm to add to Splunk, and to fill the gap between this initial backfill and the time it took me to get the add-on working, I used an NPM module. When you don’t know how to code, you’re at the mercy of the tools other people have developed. Adding the backfill data to Splunk also meant I had to adjust the max_days_ago default in props.conf, because Splunk doesn’t necessarily expect data from 10+ years ago by default. 2 scripts in 2 languages and 1 add-on builder later, I had a working solution and my Last.fm data in Splunk.
To get the iTunes data in, I used an iTunes to CSV script on Github (thanks StackExchange) to convert the library.xml file into CSV. This worked great, but again, it was in a language I don’t know (Ruby) and so I was at the mercy of a kind developer posting scripts on Github again. I was limited to whatever fields their script supported. This again only did backfill.
I’m still trying to sort out the regex and determine if it’s possible to parse the iTunes Library.xml file in its entirety and add it to Splunk without too much of a headache, and/or get it set up so that I can ad-hoc add new songs added to the library to Splunk without converting the entries some other way. Work in progress, but I’m pretty close to getting that working thanks to help from some regex gurus in the Splunk community.
For the concert data, I added the data I had into the Lookup File Editor app and was up and running. Because of some column header choices I made for how to organize my data, and the fact that I chose to maintain a lookup rather than add the information as events, I was up for some more adventures in search, but this data format made it easy to add new concerts as I attend them.
Answer these questions…with data! #
I built a lot of dashboard panels. I wanted to answer the questions I mentioned earlier, along with some others. I was spurred on by my brother recommending a song to me to listen to. I was pretty sure I’d heard the song before, and decided to use data to verify it.
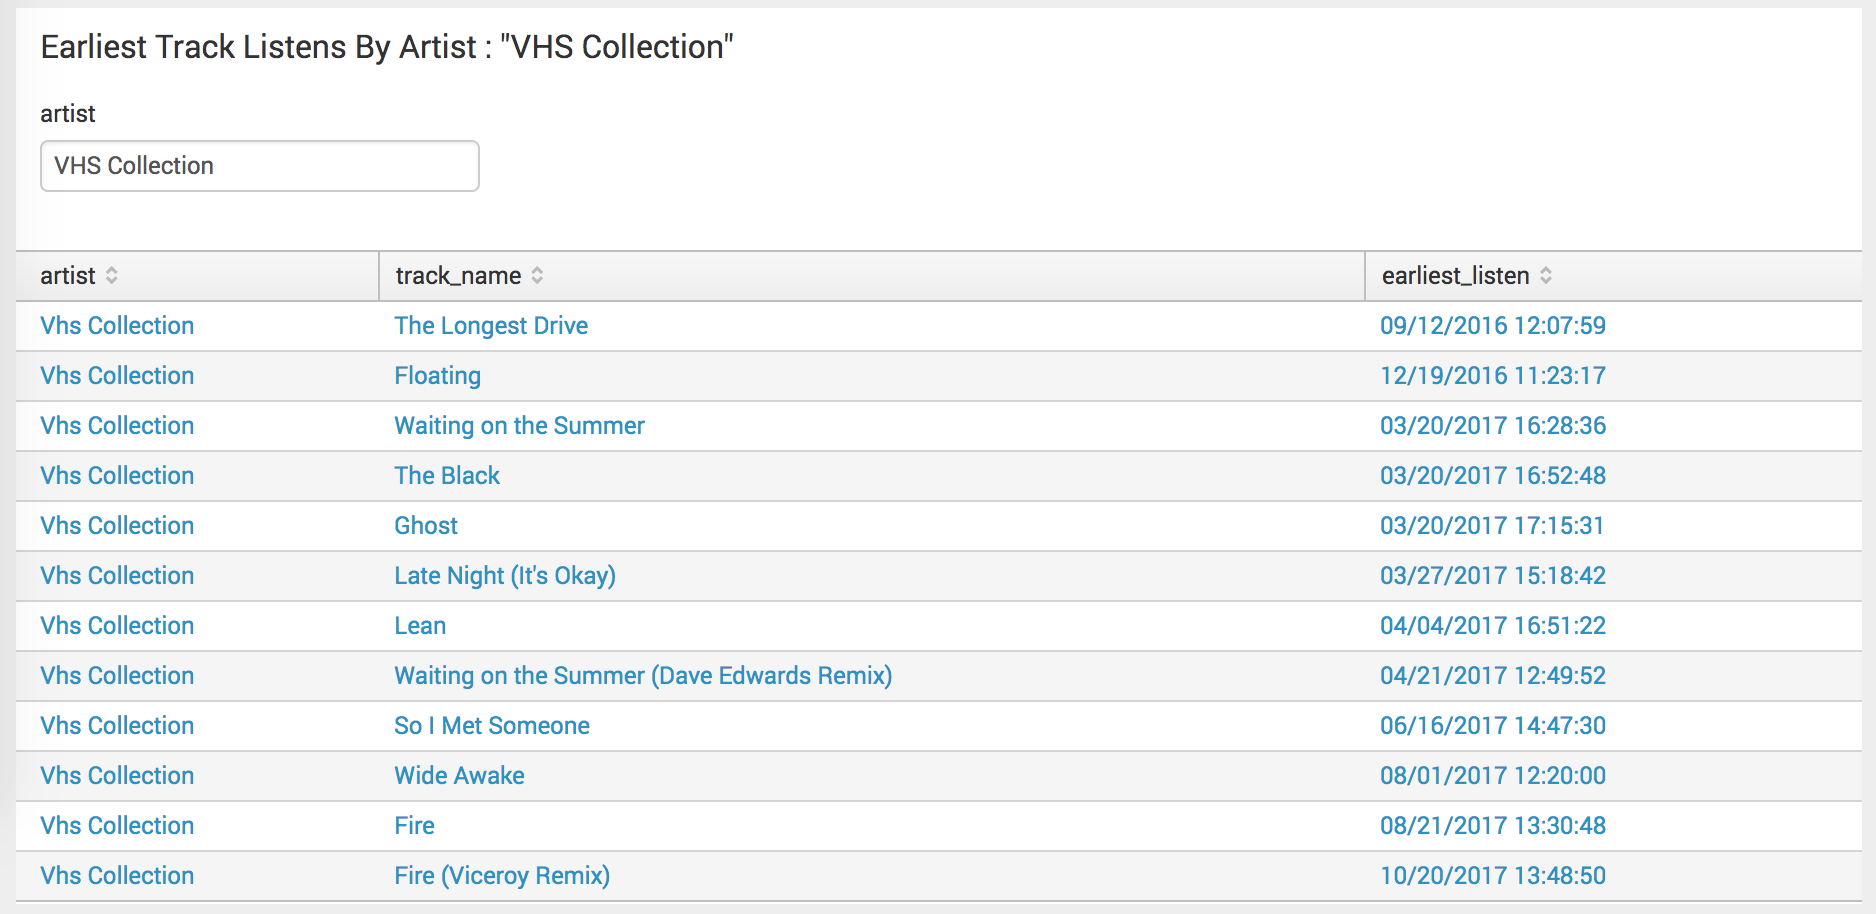
I’d first heard the song he recommended to me, Waiting on the Summer, in March. Hipster credibility: intact. Having this dashboard panel now lets me answer the questions “when was the first time I listened to an artist, and which songs did I hear first?”. I added a second panel later, to compare the earliest listens with the play counts of songs by the artist. Maybe the first song I’d heard by an artist was the most listened song, but often not.
Another question I wanted to answer was “how many concerts have I been to, and what’s the distribution in my concert attendance?”
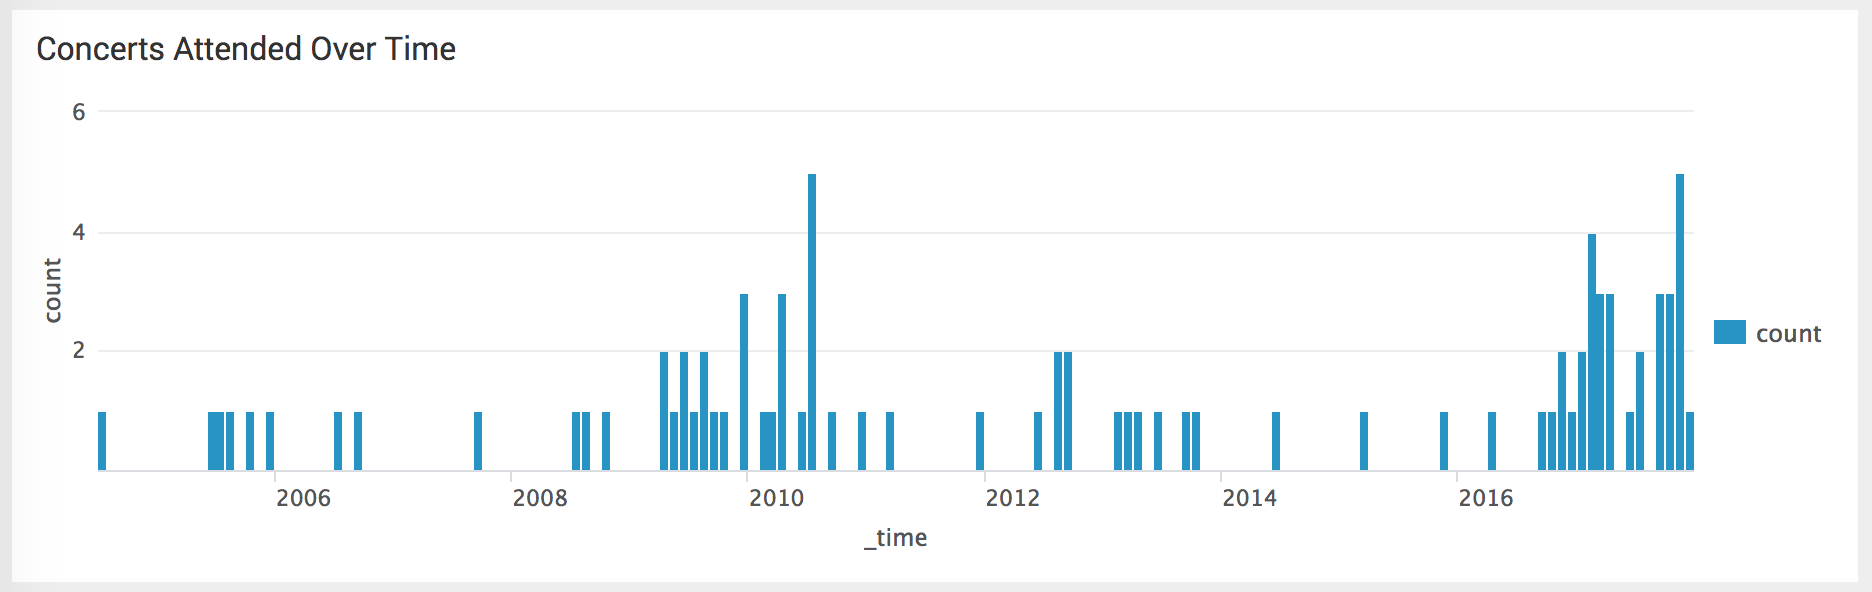
It’s pretty fun to look at this chart. I went to a few concerts while I was in high school, but never more than one a month and rarely more than a few per year. The pace picked up while I was in college, especially while I was dating someone that liked going to concerts. A slowdown as I studied abroad and finished college, then it picks up for a year as I get settled in a new town. But after I get settled in a long-term relationship, my concert attendance drops off, to where I’m going to fewer shows than I did in high school. As soon as I’m single again, that shifts dramatically and now I’m going to 1 or more show a month. The personal stories and patterns revealed by the data are the fun part for me.
I answered some more questions, especially those that could be answered by fun graphs, such as what states have my concentrated music listens?
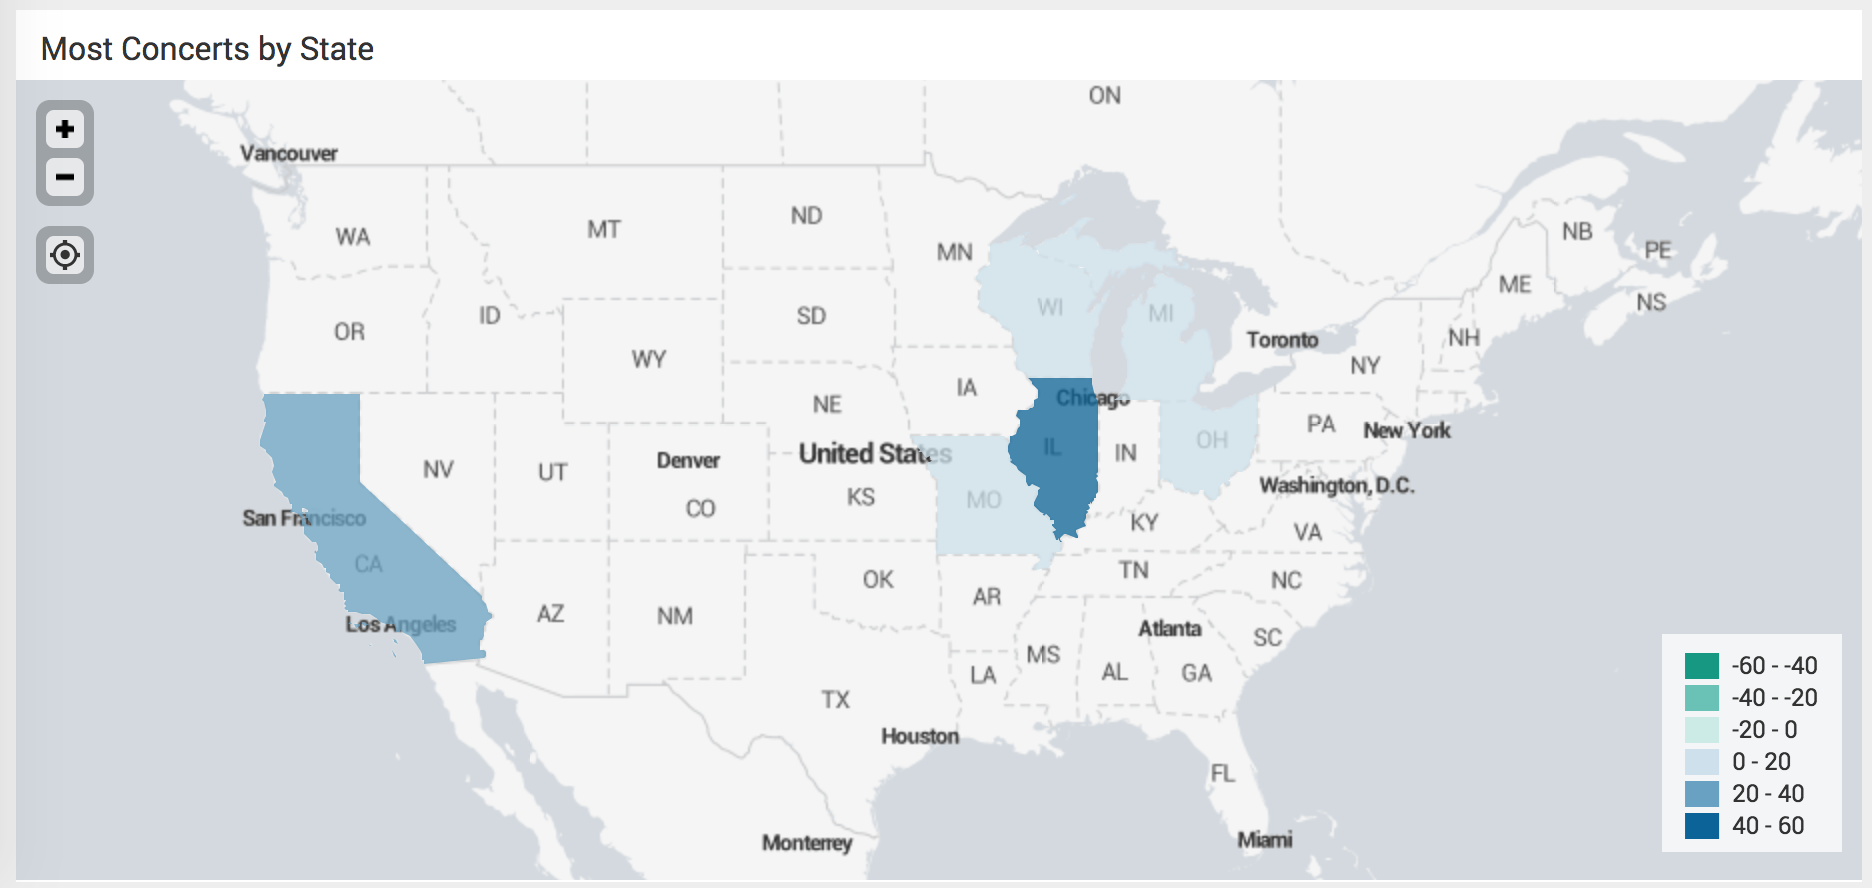
It’s easy to tell where I’ve spent most of my life living so far, but again the personal details tell a bigger story. I spent more time in Michigan than I have lived in California so far, but I’ve spent more time single in California so far, thus attending more concerts.
Speaking of California, I also wanted to see what my most-listened-to songs were since moving to California. I used a trellis visualization to split the songs by artist, allowing me to identify artists that were more popular with me than others.
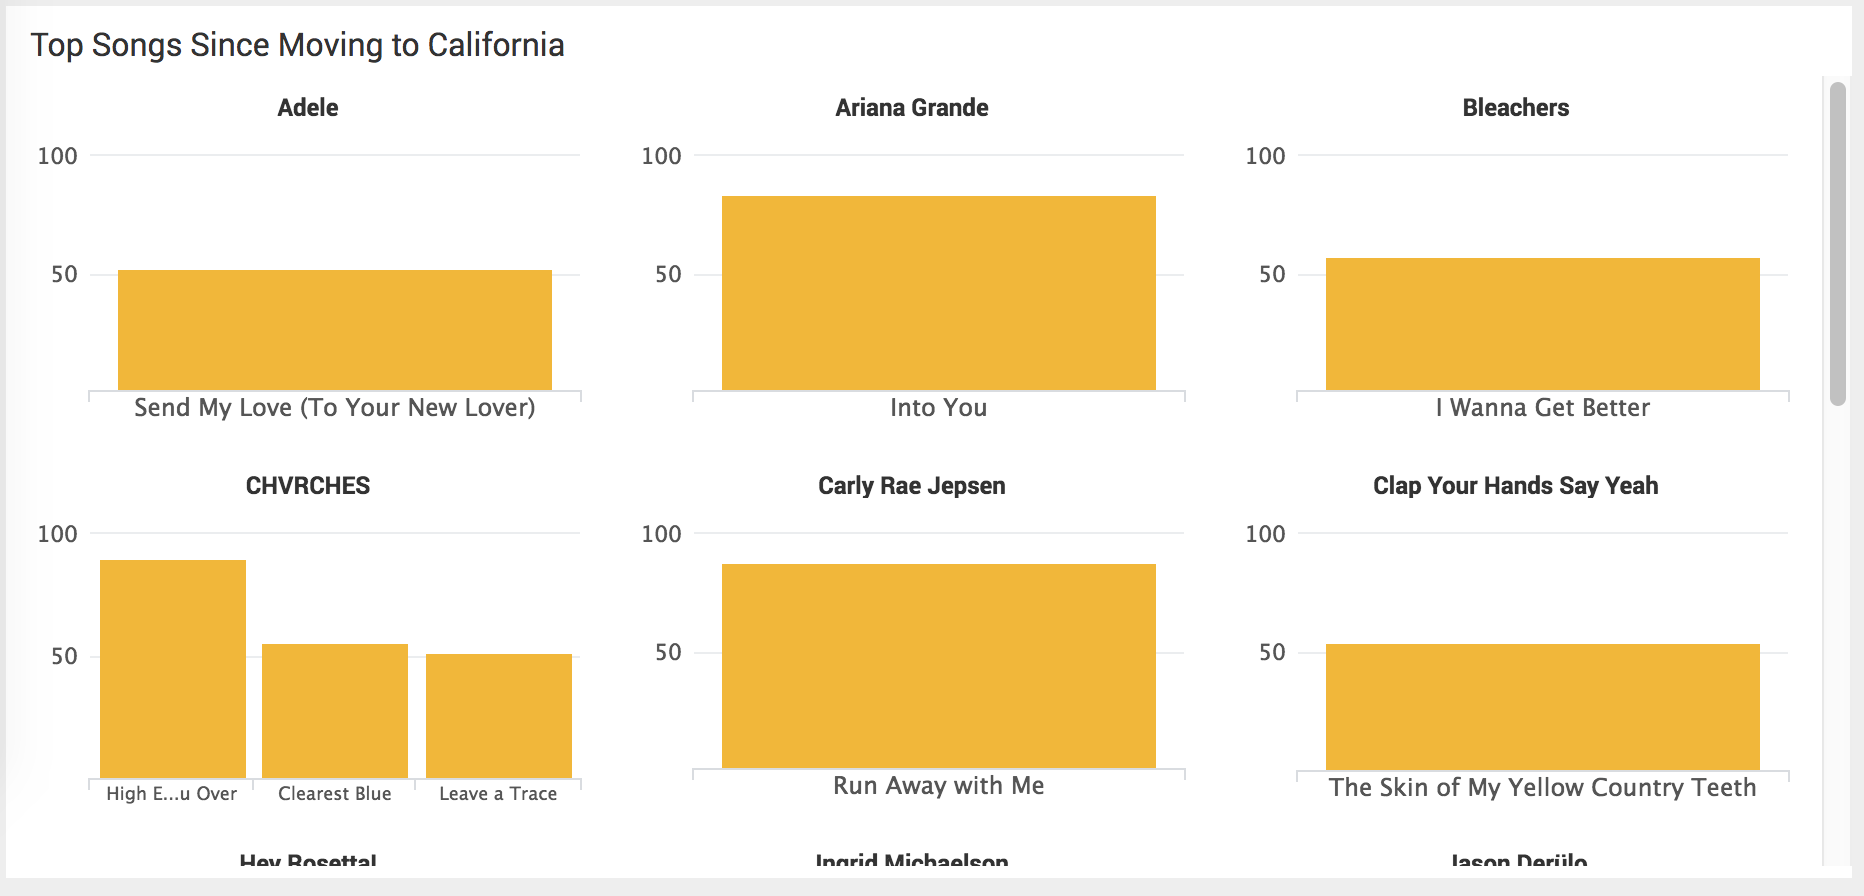
I really liked the CHVRCHES album Every Open Eye, so I have three songs from that album. I also spent some time with a four song playlist featuring Adele’s song Send My Love (To Your New Lover), Ariana Grande’s Into You, Carly Rae Jepsen’s Run Away With Me, and Ingrid Michaelson’s song Hell No. Somehow two breakup songs and two love songs were the perfect juxtaposition for a great playlist. I liked it enough to where all four songs are in this list (though only half of it is visible in this screenshot). That’s another secret behind the data.
I also wanted to do some more analytics on my concert data, and decided to figure out what my favorite venues were. I had some guesses, but wanted to see what the data said.
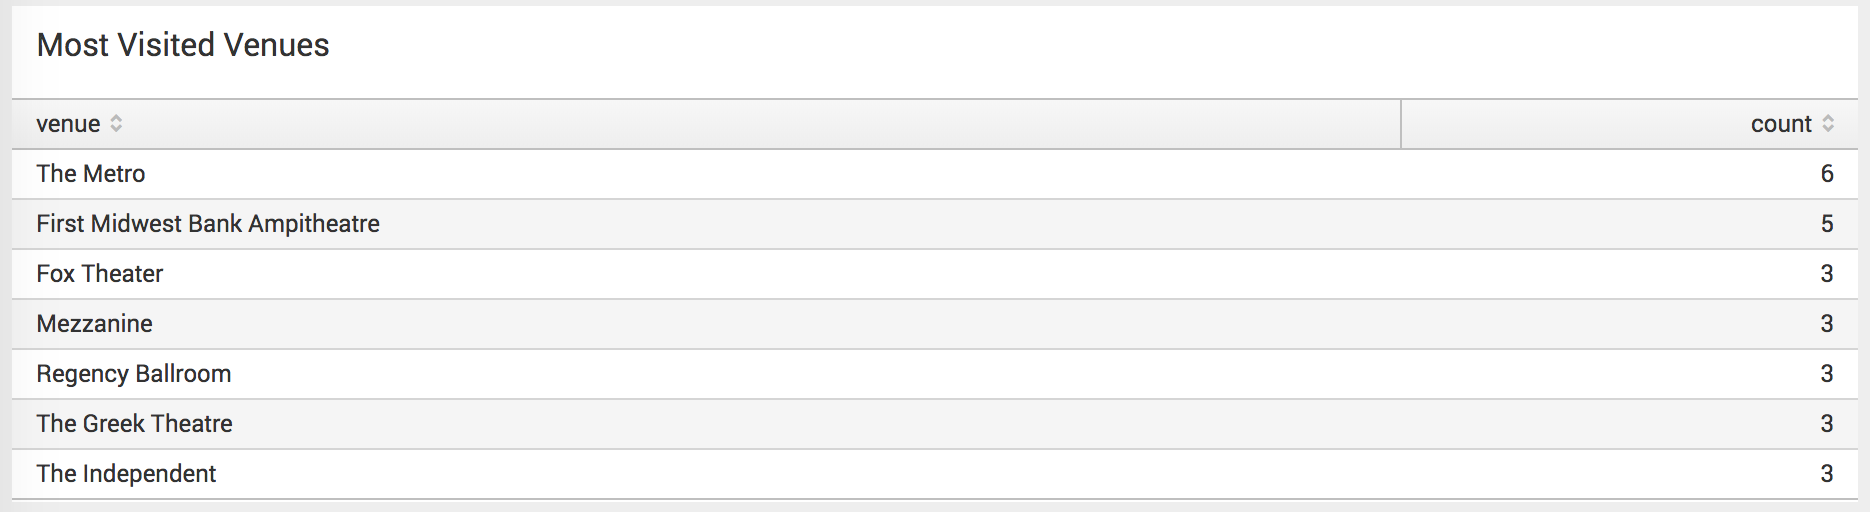
The Metro is my favorite venue in Chicago, so it’s no surprise that it came in first in the rankings (I also later corrected the data to make it its proper name, “Metro” so that I could drill down from the panel to a Google Maps search for the venue). First Midwest Bank Ampitheatre hosted Warped Tour, which I attended (apparently) 5 times over the years. Since moving to California it seems like I don’t have a favorite venue based on visits alone, but it’s really The Independent, followed by Bill Graham Civic Auditorium, which doesn’t even make this list. Number of visits doesn’t automatically equate to favorite.
But what does it MEAN? #
I could do data analysis like that all day. But what else do I learn by just looking at the data itself?
I can tell that Last.fm didn’t handle the shift to mobile and portable devices very well. It thrives when all of your listening happens on your laptop, and it can grab the scrobbles from your iPod or other device when you plug it into your computer. But as soon as internet-connected devices got popular (and I started using them), listens scrobbled overall dropped. In addition to devices, the rise of streaming music on sites like Grooveshark and SoundCloud to replace the shift from MediaFire-hosted and MegaUpload-hosted free music shared on music blogs also meant trouble for my data integrity. Last.fm didn’t handle listens on the web then, and only handles them through a fragile extension now.
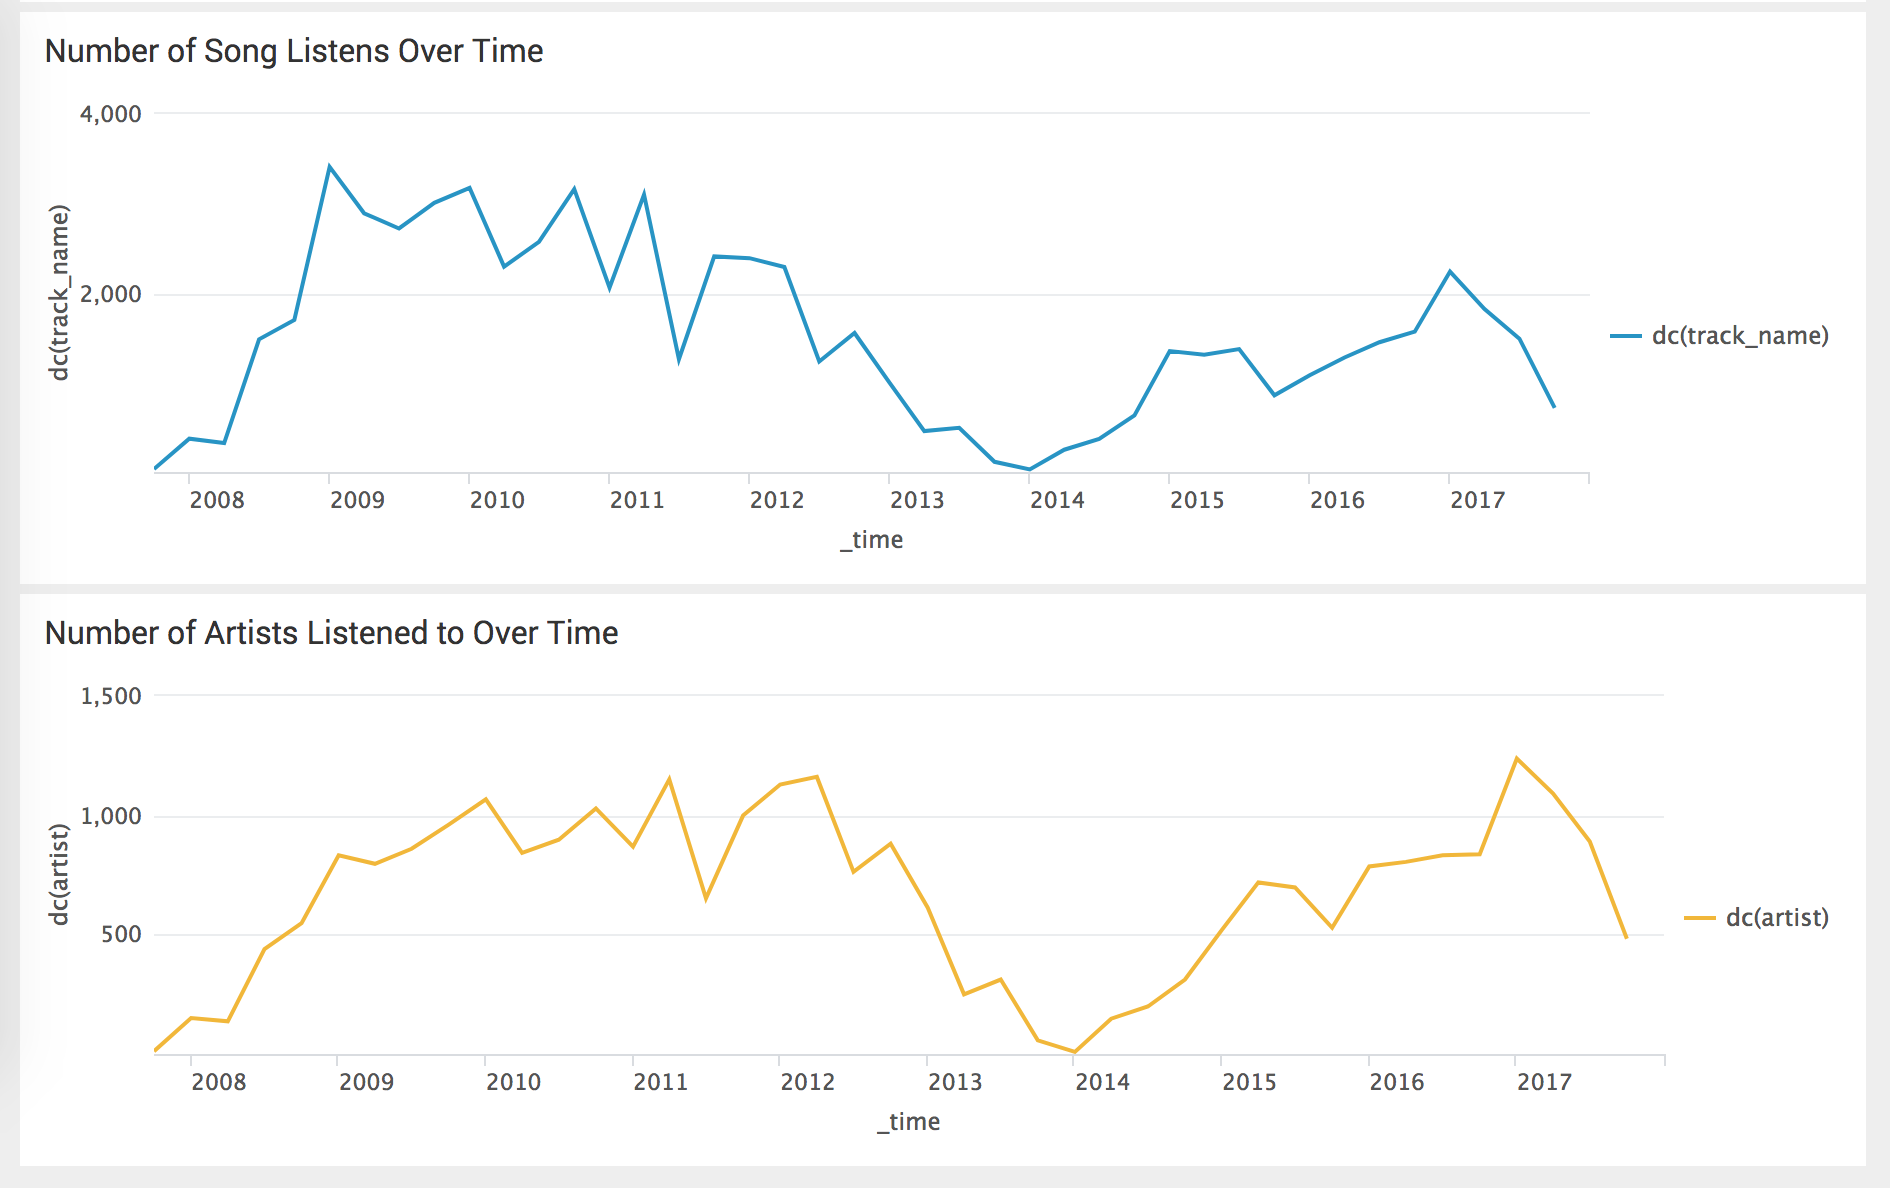
Distinct songs and artists listened to in Last.fm data.But that’s not the whole story. I also got a job and started working in an environment where I couldn’t listen to music at work, so wasn’t listening to music there, and also wasn’t listening to music at home much either due to other circumstances. Given that the count plummets to near-zero, it’s possible there were also data issues at play. It’s imperfect, but still fascinating.
What else did I learn?
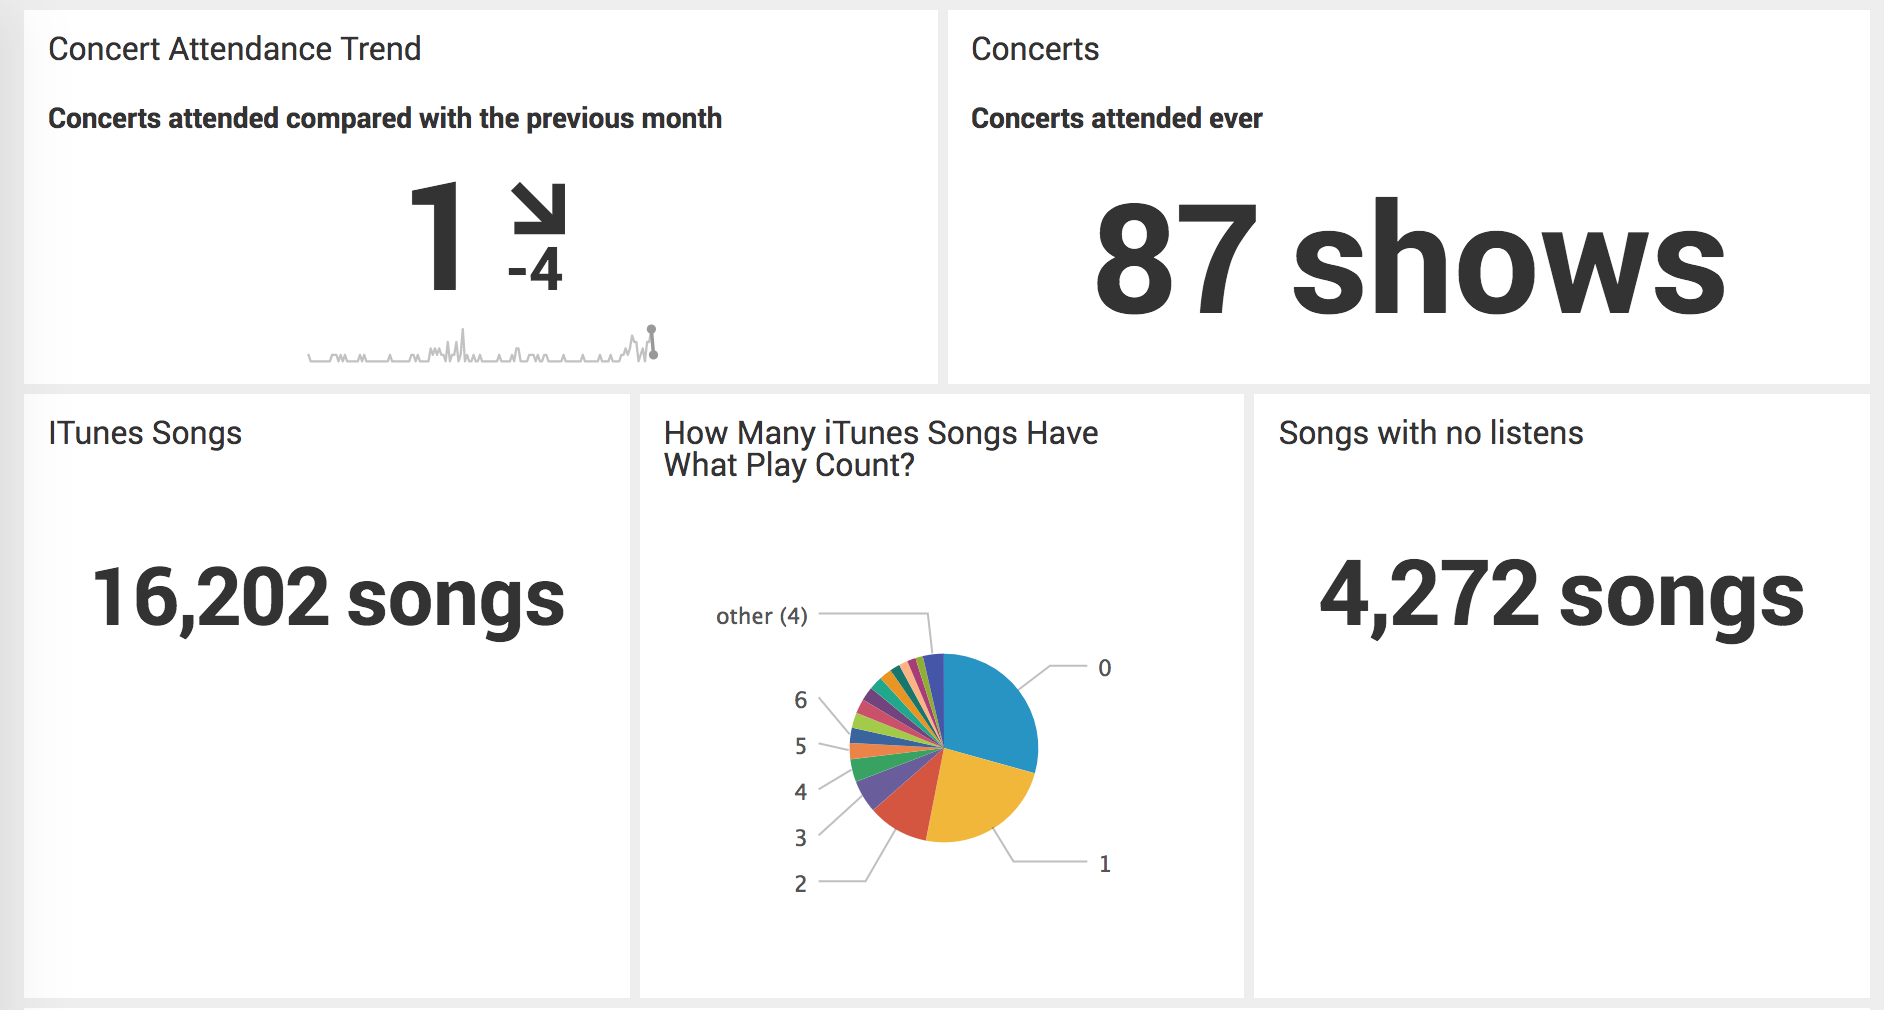
I have a lot of songs in my iTunes library. I haven’t listened to nearly 30% of them. I’ve listened to nearly 25% of them only once. That’s the majority of my music library. If I split that by rating, however, it would get a lot more interesting. Soon.
You can’t see the fallout from my own personal Music-ocalypse in this data, because the Library.xml file doesn’t know which songs don’t point to actual files, or at least my version of it doesn’t. I’ll need more high-fidelity data to determine the “actual” size of my library, and perform more analyses.
I need more data in general, and more patience, to perform the analyses to answer the more complex questions I want to answer, like my listening habits of particular artists around a concert. As it is, this is a really exciting start.
If you want more details about the actual Splunking I did to do these analyses, I’ll be posting a blog on the official Splunk blog. That got posted on January 4th! Here it is: 10 Years of Listens: Analyzing My Music Data with Splunk.